
For anyone trying to conceive, the two-week wait can feel like the longest stretch of time imaginable. Each day brings a mix of hope and anxiety as you look for any sign, any clue, that this month might be different. Basal Body Temperature (BBT) charting offers a way to tune into your body’s subtle signals, providing one of the earliest windows into your cycle’s outcome.
Table of Contents
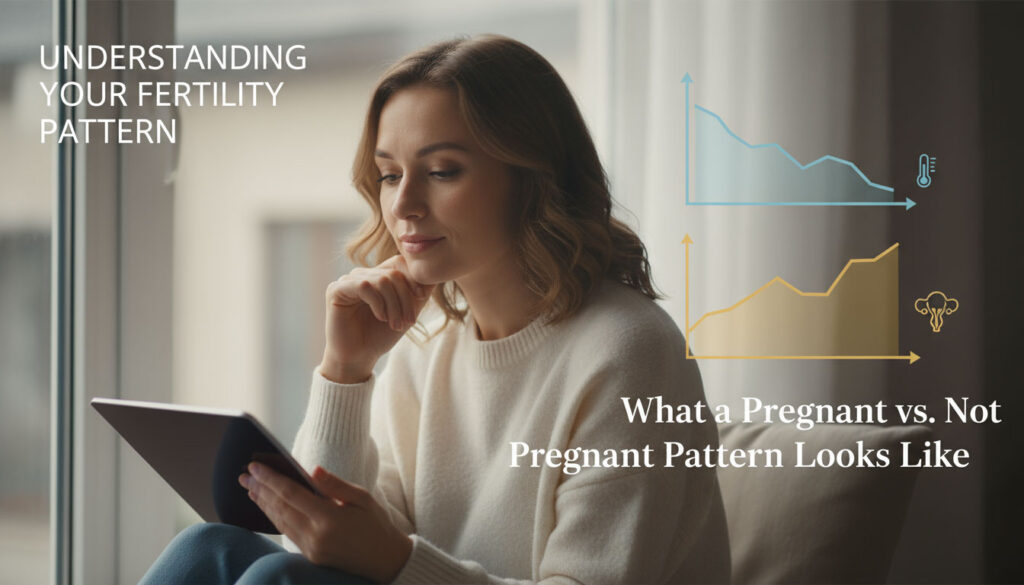
Understanding the key differences in a BBT chart pregnant vs not pregnant can transform that period of uncertainty into one of empowered observation. This guide will help you decode those temperature shifts, moving beyond guesswork to interpret your data with confidence. We will explore the science, analyze the distinct patterns, and provide actionable steps to use your basal body temperature pregnancy chart as a reliable early indicator.
The Science of Your Cycle: Why Your Temperature Changes
Your basal body temperature, your body’s lowest resting temperature, is not static. It ebbs and flows in a predictable rhythm orchestrated by the hormones that govern your menstrual cycle. Grasping this fundamental science is the first step in mastering basal body temperature tracking and understanding the story your body is telling you.
The Two Phases of Your Menstrual Cycle
Your entire cycle is a tale of two distinct halves, each with its own hormonal and thermal signature. Recognizing these phases on your chart is crucial for identifying a potential early pregnancy BBT pattern. This biphasic pattern is the foundation of all BBT interpretation.

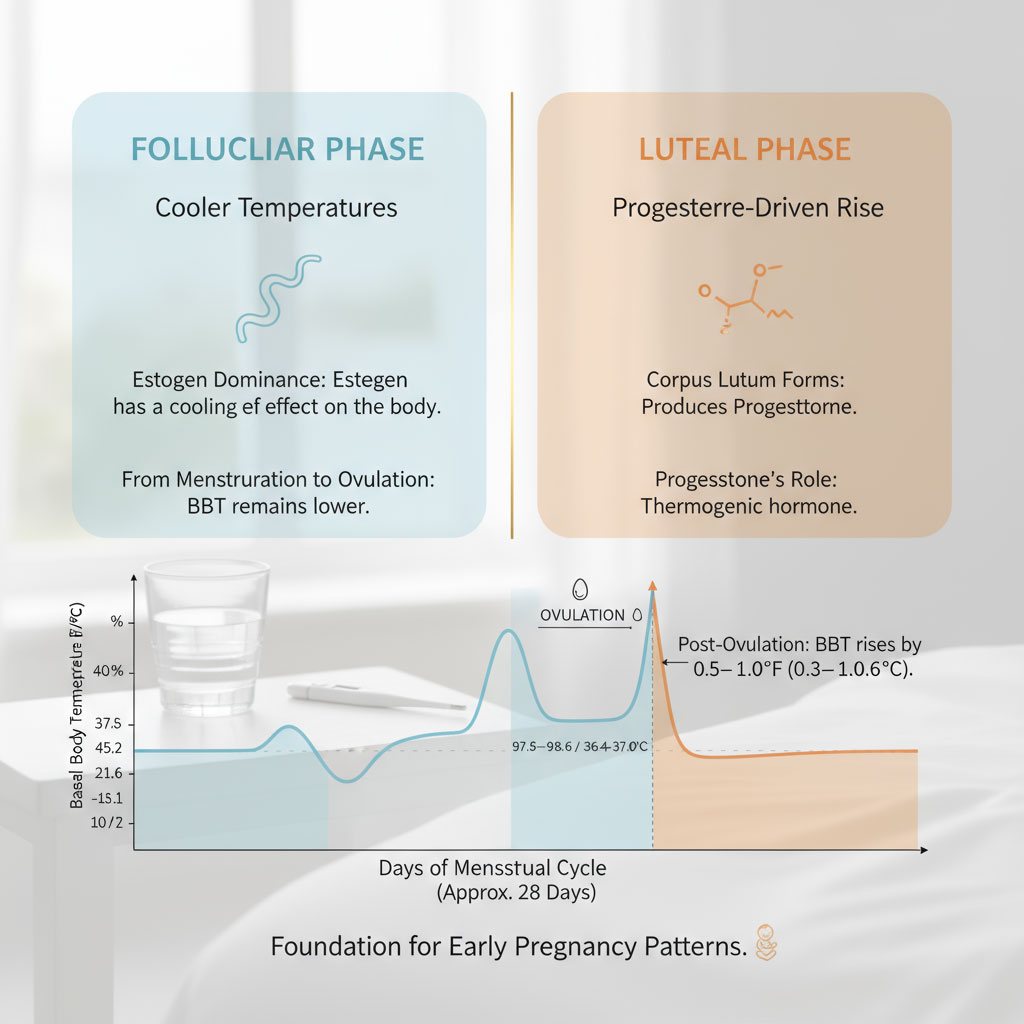
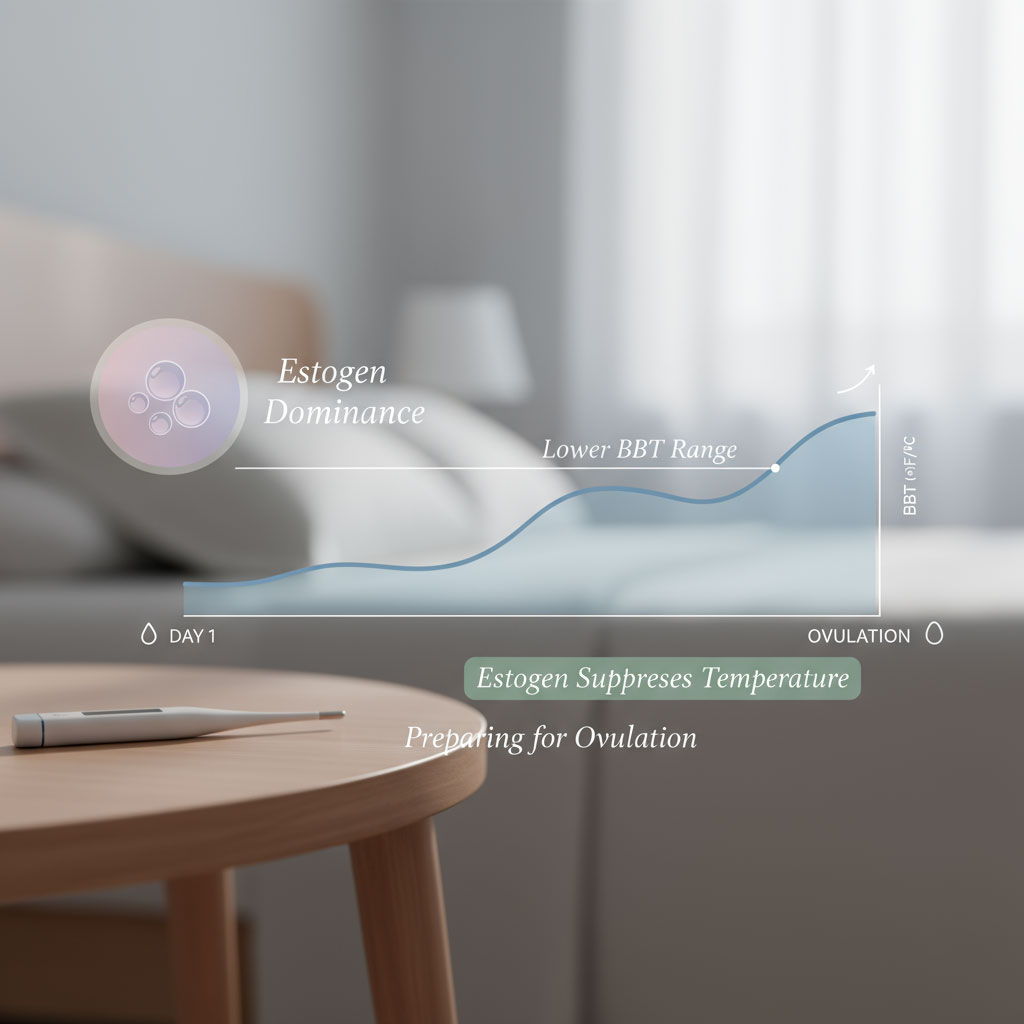
The Follicular Phase: Cooler Temperatures Prevail
From the first day of your period until ovulation, you are in the follicular phase. During this time, the hormone estrogen is dominant. Estrogen, produced by the developing egg follicles in your ovaries, has a primary job: to thicken the uterine lining and prepare your body for ovulation. A key characteristic of estrogen is its suppressive effect on body temperature, which is why your BBT readings will consistently remain in a lower range during this phase.
The Luteal Phase: The Progesterone-Fueled Rise
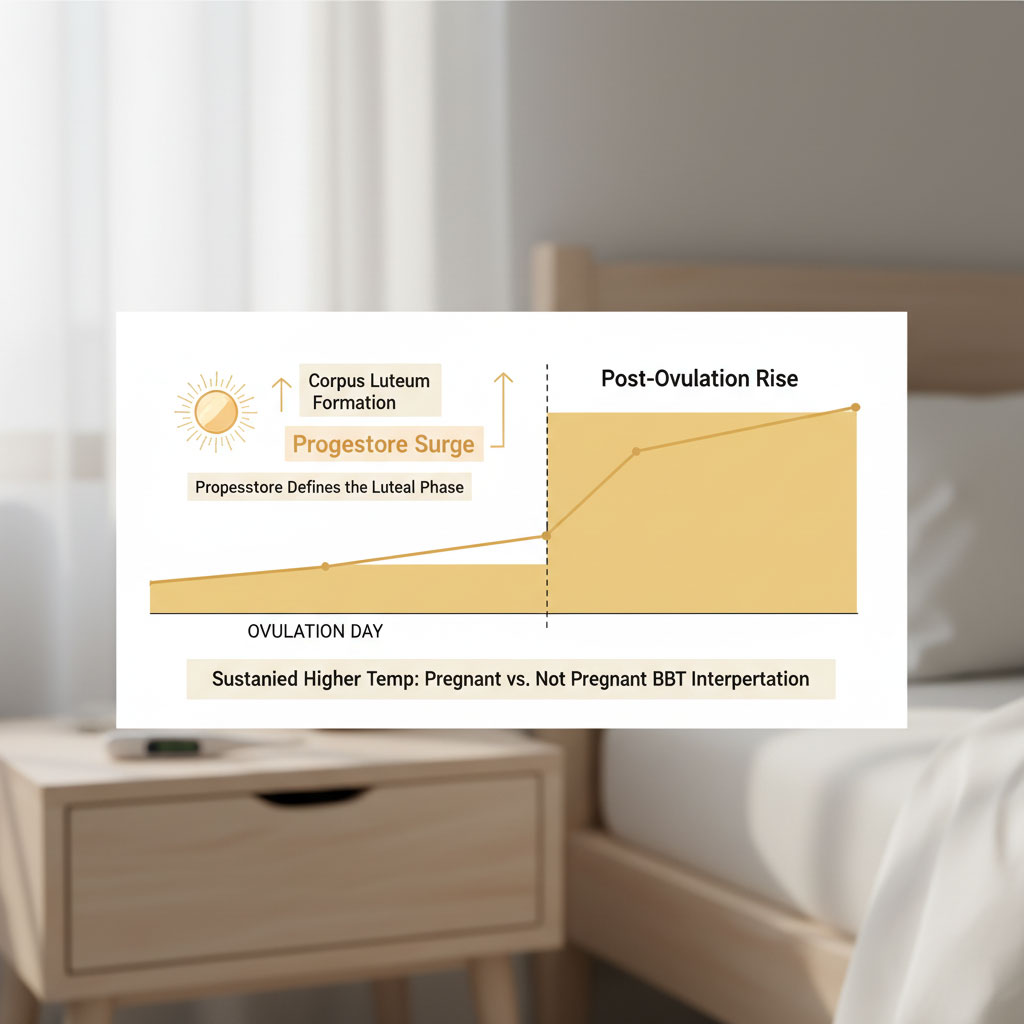
After ovulation occurs, the script flips entirely. The follicle that released the egg undergoes a transformation, becoming a temporary endocrine structure called the corpus luteum. This marks the beginning of the luteal phase, the critical timeframe for understanding the difference between a BBT chart pregnant vs not pregnant. The corpus luteum’s primary role is to pump out progesterone, the hormone that will define the rest of your cycle.
Progesterone: The Heat-Inducing Hormone
Progesterone is the star of the second half of your cycle, and its relationship with your body temperature is direct and measurable. Its main function is to make the uterine lining receptive to a fertilized egg, essentially preparing a nourishing environment for a potential pregnancy. A key side effect of this vital hormonal surge is its thermogenic nature, meaning it generates heat.
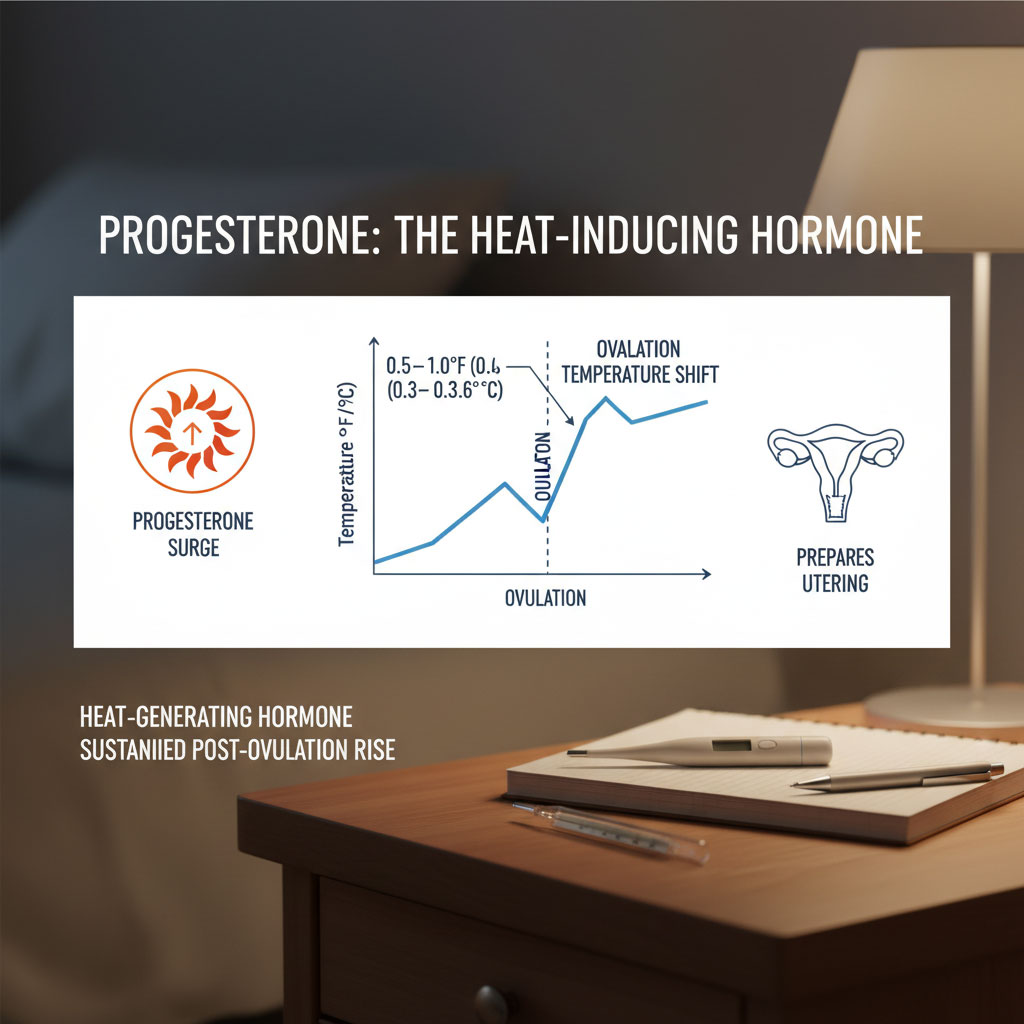
This relationship between progesterone and BBT is what makes charting possible. As progesterone levels rise sharply after ovulation, your basal body temperature follows suit, increasing by about 0.5 to 1.0°F (0.3 to 0.6°C). This sustained thermal increase, known as the ovulation temperature shift, is the clear signal on your chart that ovulation has successfully occurred.
Decoding the Non-Pregnant BBT Chart: A Predictable Pattern
When you are trying to conceive, seeing a negative pattern can be disappointing, but understanding it is empowering. A non-pregnant menstrual cycle temperature chart follows a clear and predictable trajectory, providing valuable data that can help you better understand your body and plan for your next cycle.
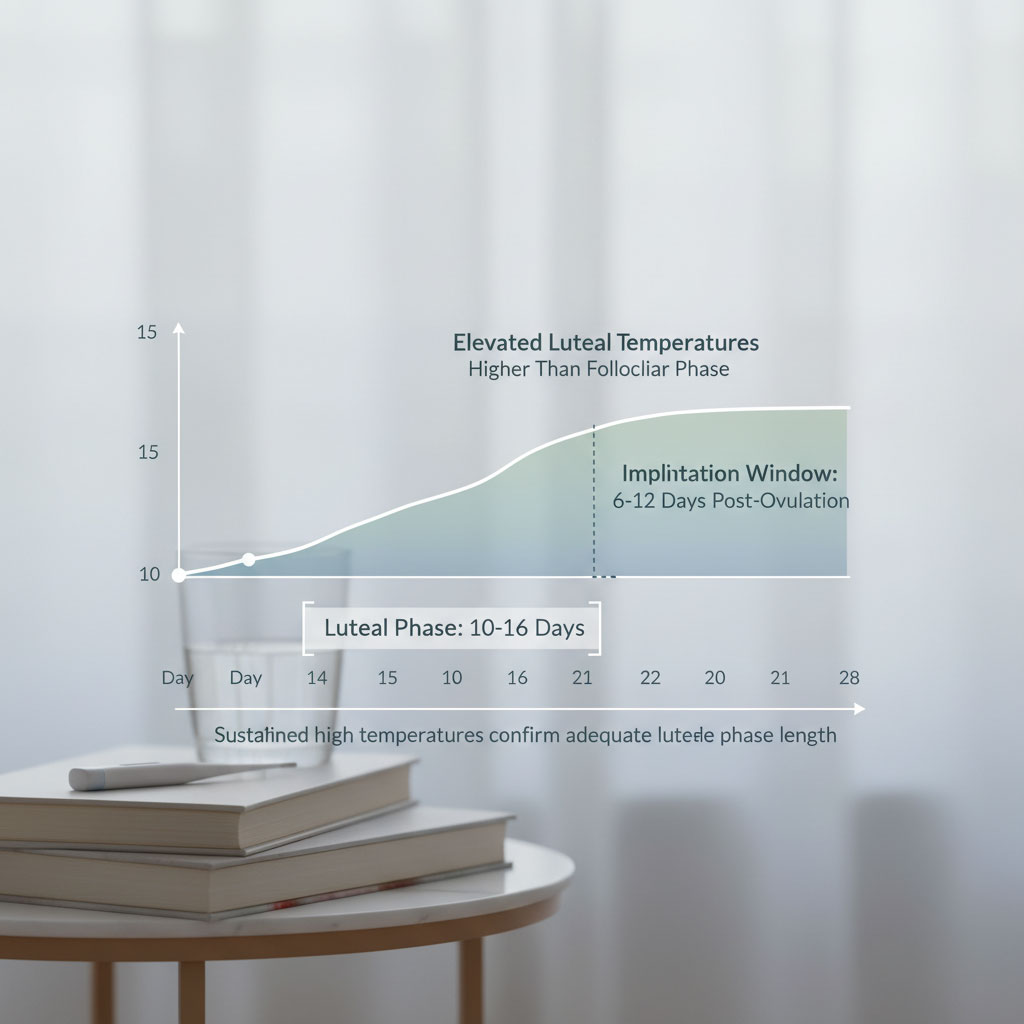
The Post-Ovulation Rise and Luteal Phase Length
Immediately following your ovulation temperature shift, your BBT will remain elevated in a higher range than your follicular phase temperatures. This period of high temperatures is your luteal phase. In a healthy, fertile cycle, the luteal phase temperature pattern should be sustained for between 10 to 16 days. Charting is one of the best ways to confirm that your luteal phase is long enough to allow for successful implantation, which typically happens 6 to 12 days after ovulation.
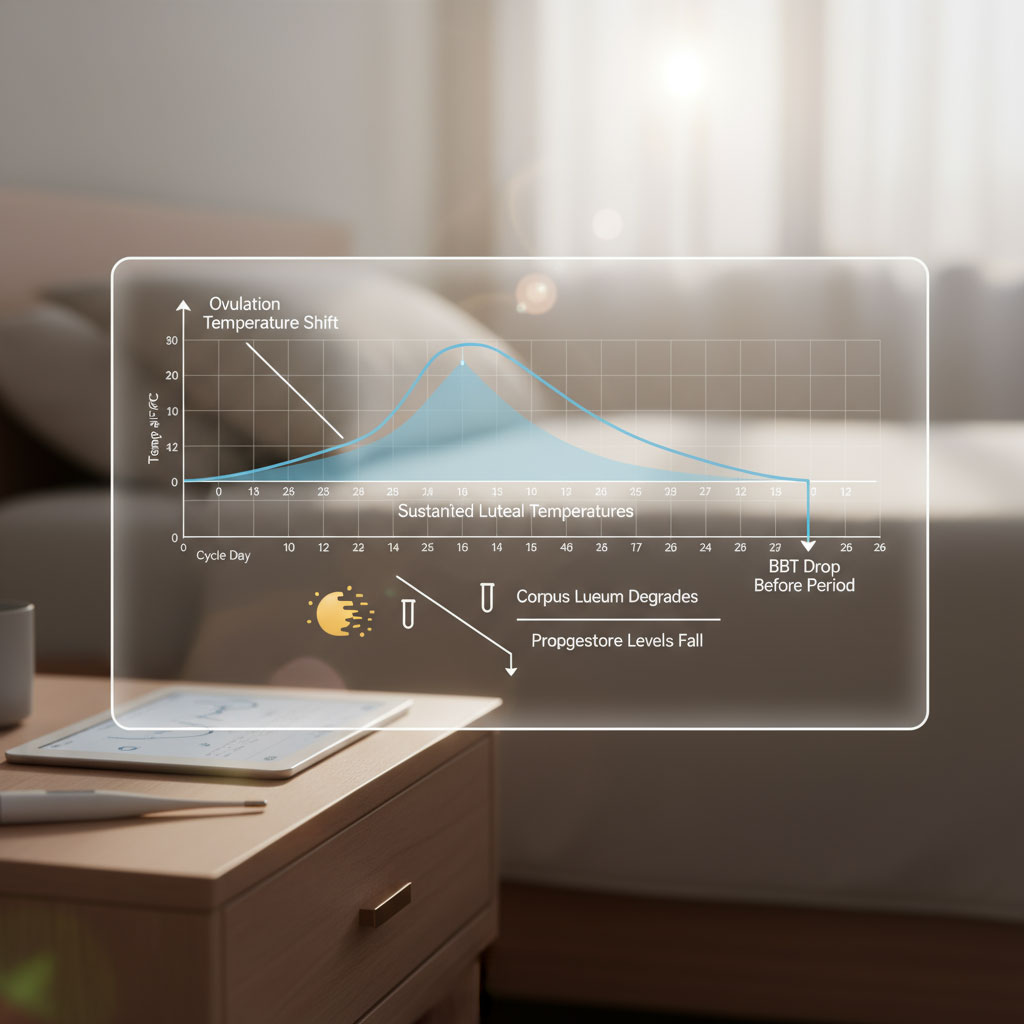
The Signature Signal: The BBT Drop Before a Period
If fertilization or implantation does not happen, the corpus luteum has a limited lifespan. It begins to degrade roughly 10 to 14 days after ovulation. This natural breakdown causes a sharp and rapid decline in progesterone production. Without the constant supply of the heat-inducing hormone progesterone, your body temperature plummets.
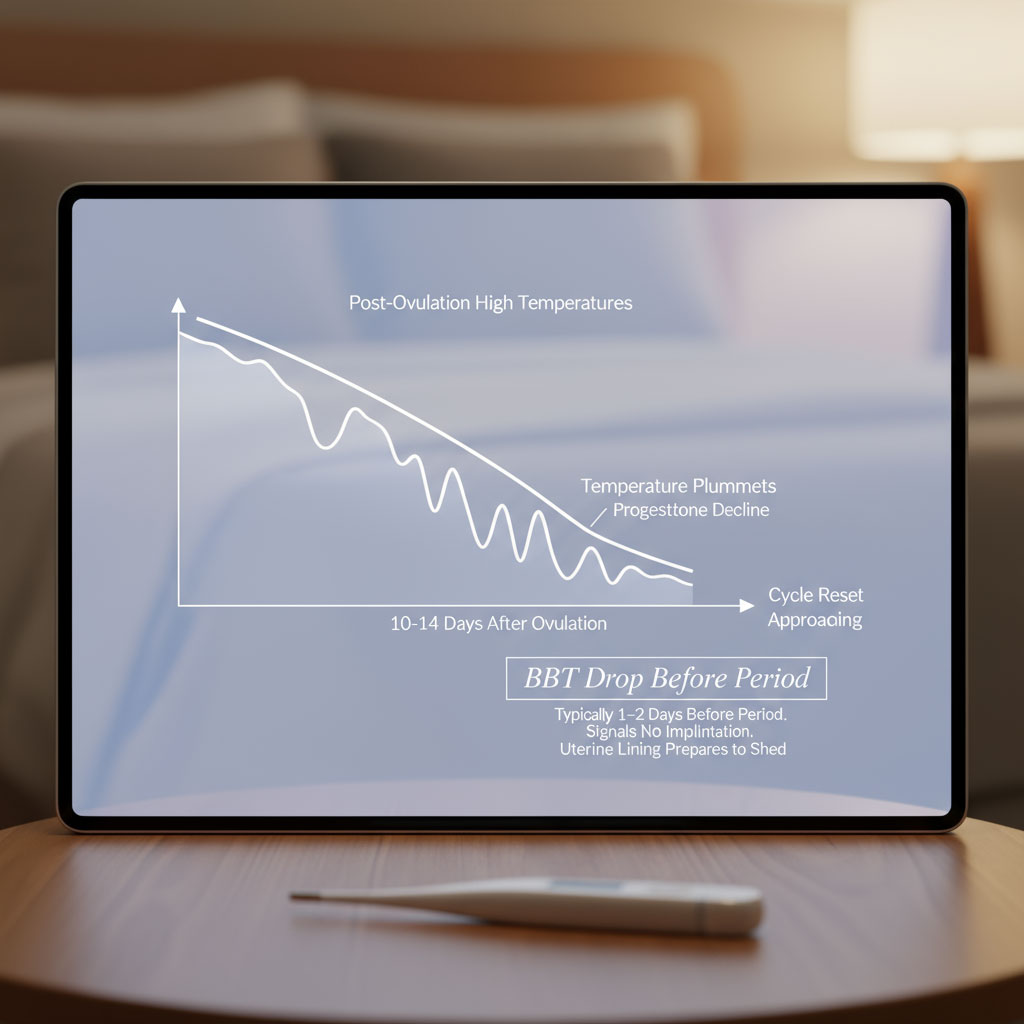
This noticeable BBT drop before period is the most reliable indicator on a chart that you are not pregnant. Typically, you will observe this drop a day or two before your period begins, serving as a clear signal that your uterine lining is preparing to shed and your cycle is about to reset. Recognizing this pattern helps you anticipate your period and emotionally prepare for the next cycle with new information.
The Pregnant BBT Chart: Unmistakable Signs of Early Pregnancy
Now for the pattern every hopeful parent is looking for. A pregnant BBT chart tells a different and much more exciting story. Instead of a decline signaling the end of the cycle, it showcases a persistent thermal shift that defies expectations, offering one of the very first physiological signs of pregnancy. So, what does a pregnant BBT chart look like?
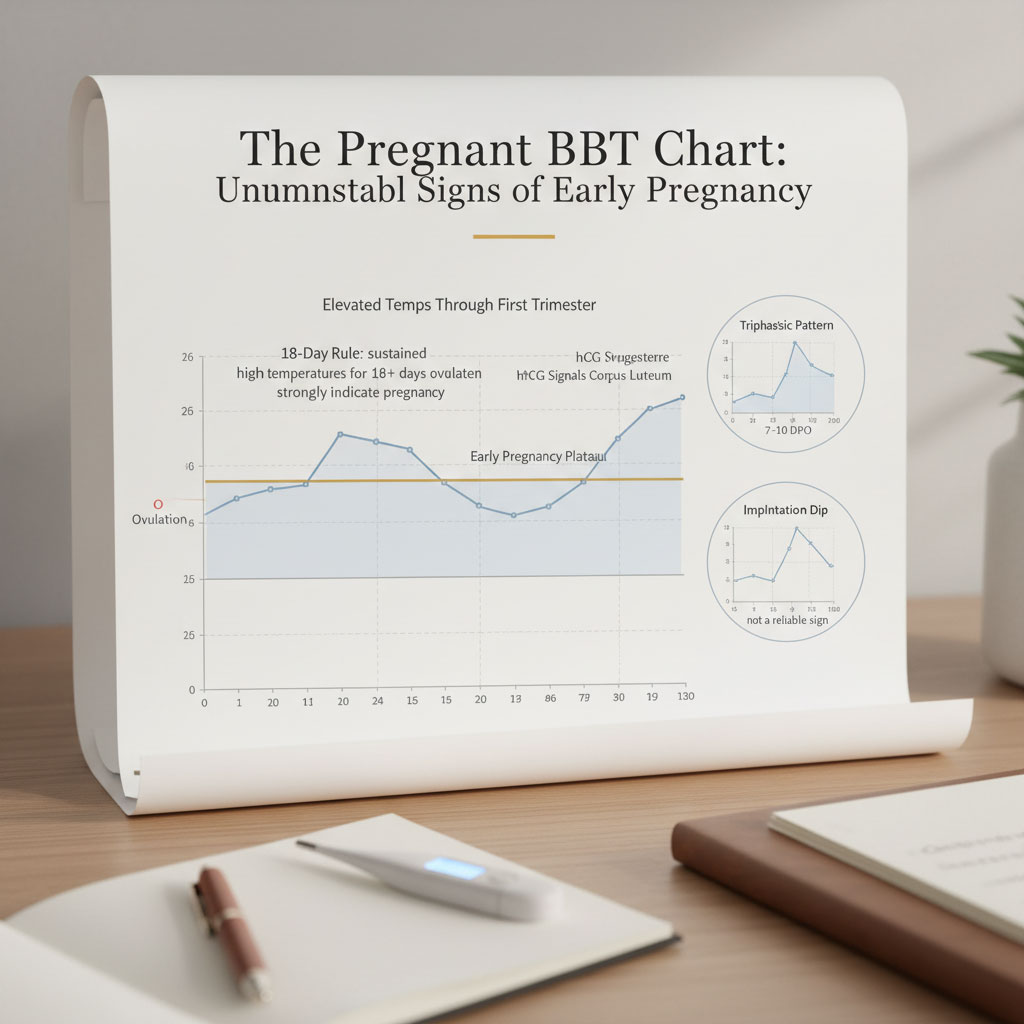
The 18-Day Rule: The Gold Standard for BBT Pregnancy Signs
The single most reliable indicator of pregnancy on a BBT chart is the length of the luteal phase. If you observe a sustained temperature rise after ovulation that lasts for 18 or more consecutive days without a drop, the probability of pregnancy is extremely high.
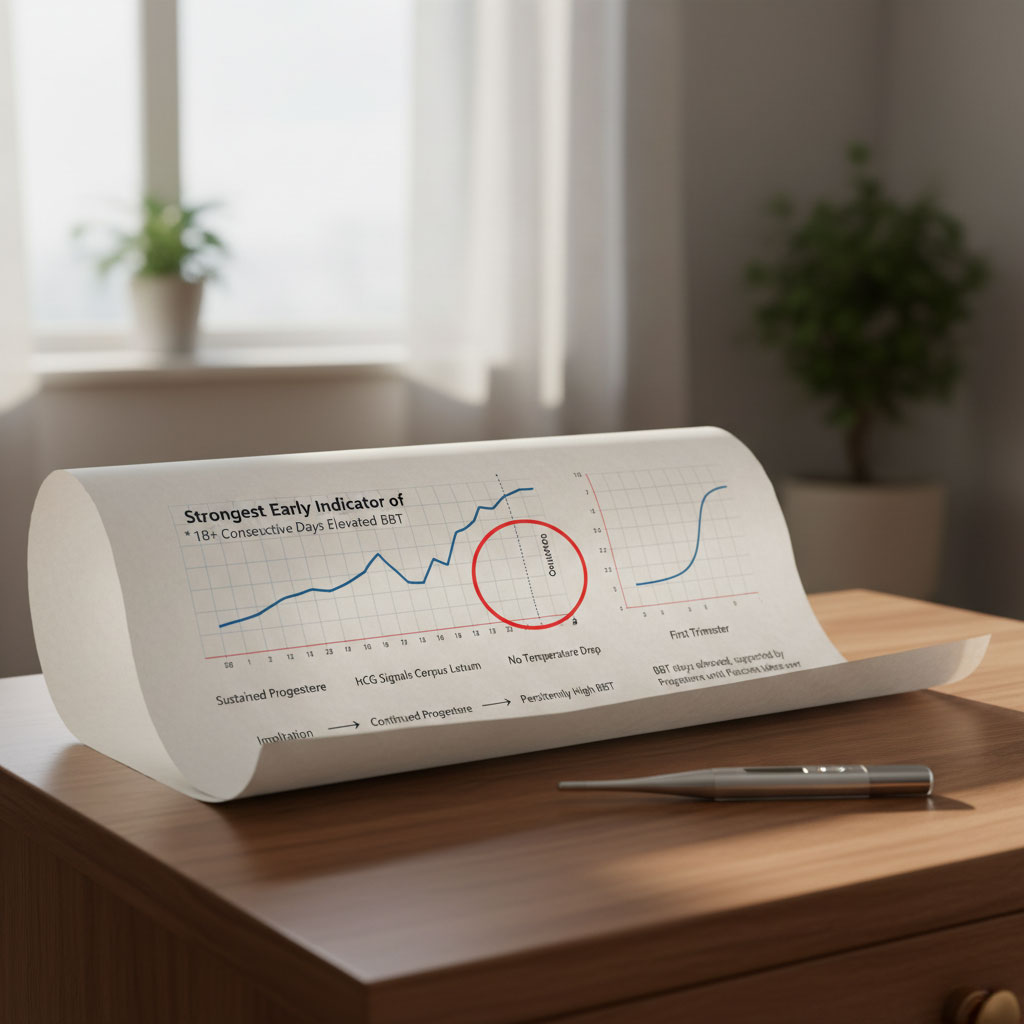
This “18-day rule” is the gold standard for a positive BBT chart. While a home pregnancy test works by detecting the hormone hCG, your chart works by tracking the effect of sustained progesterone. When implantation occurs, the developing embryo starts producing hCG, which in turn signals the corpus luteum to keep producing progesterone, thus keeping your temperature elevated.
How Long Does BBT Stay High if Pregnant?
Your basal body temperature will remain elevated throughout your entire first trimester, supported by the high levels of progesterone necessary to maintain the pregnancy. After the first trimester, the placenta fully takes over progesterone production, and hormonal fluctuations can make basal body temperature pregnancy tracking less reliable as an indicator of pregnancy health.
What an Early Pregnancy BBT Pattern Looks Like
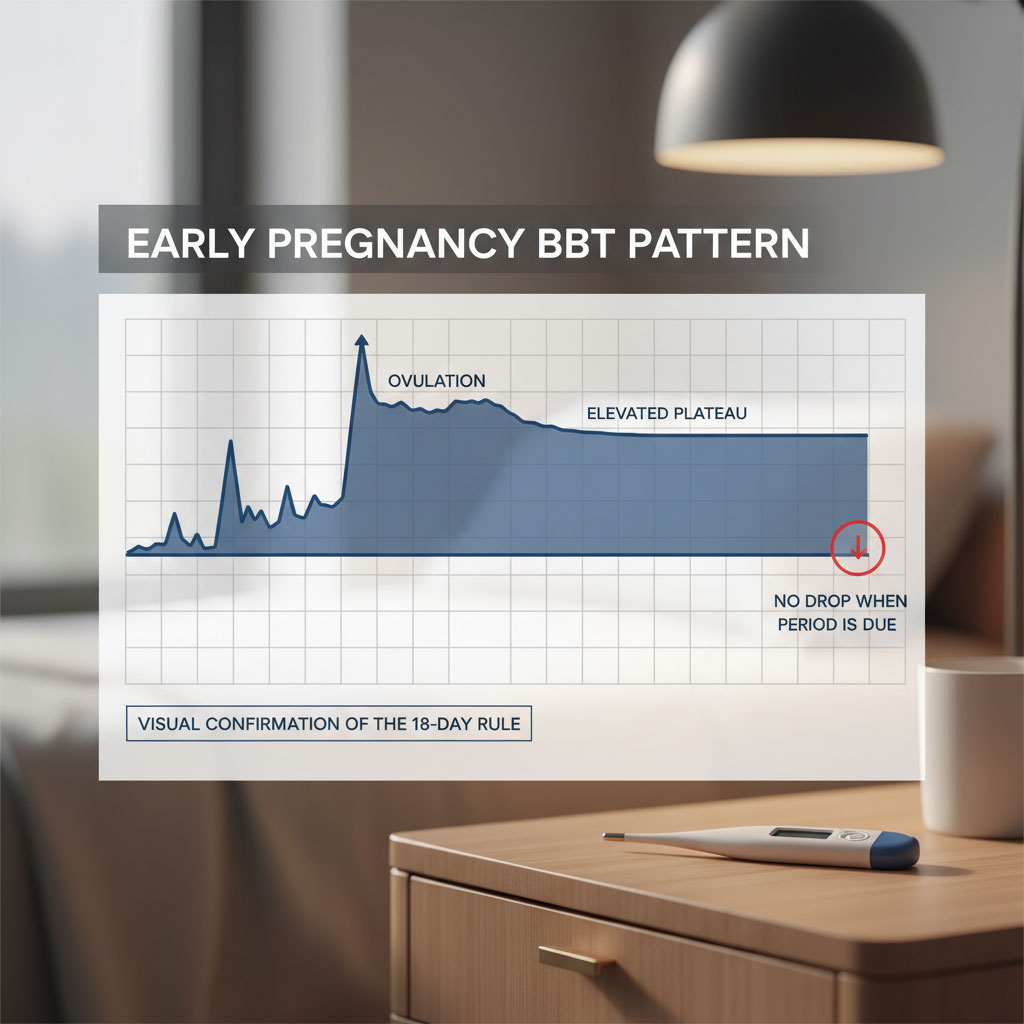
The classic early pregnancy BBT pattern is a beautiful, elevated plateau of high temperatures. After the initial post-ovulation rise, the temperatures stay consistently high, refusing to drop when your period would have been due. This lack of a premenstrual temperature drop is the clear visual confirmation of what the 18-day rule quantifies, making it a very exciting pattern to watch unfold.
Advanced and Less Common Pregnancy Patterns
While browsing online fertility forums or using tracking apps, you will undoubtedly encounter discussions about more nuanced chart patterns. It is important to understand what they are and how much weight to give them when interpreting your BBT chart pregnant vs not pregnant.
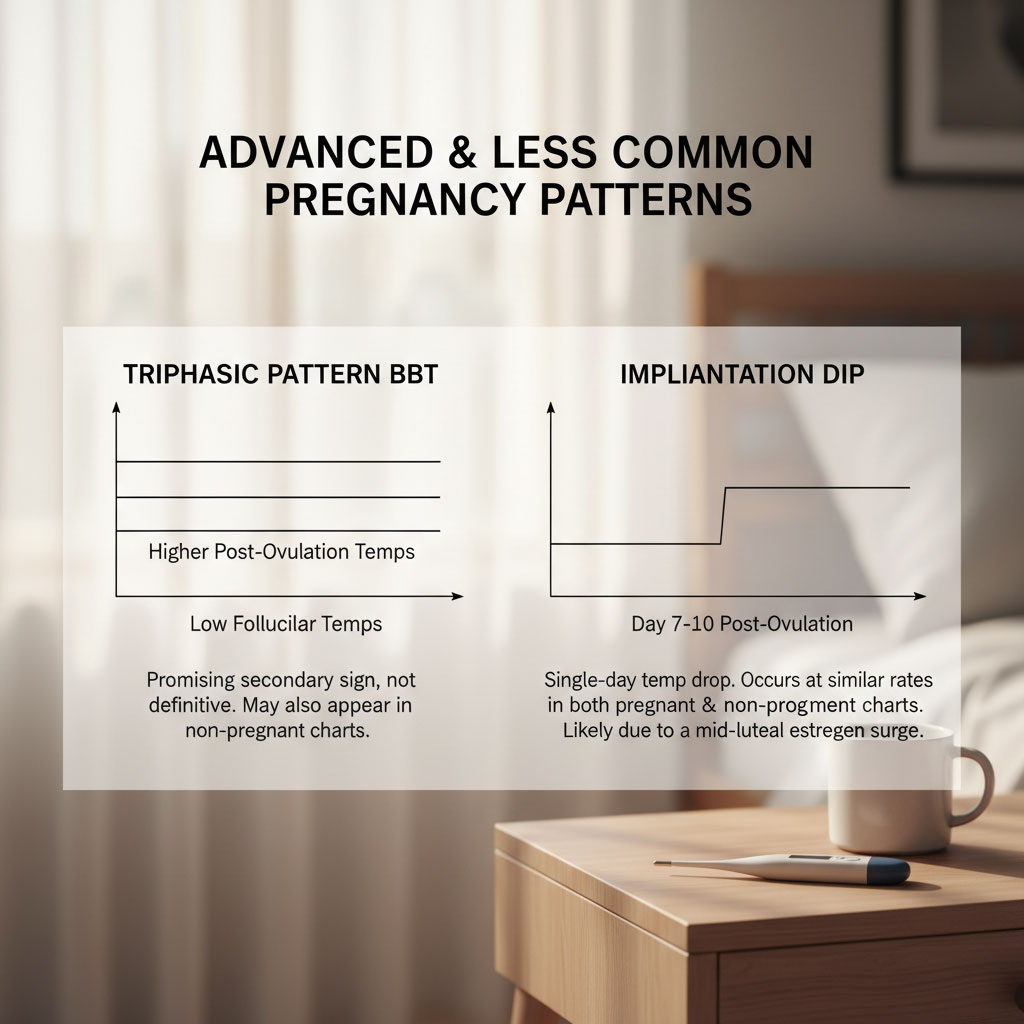
The Triphasic Pattern BBT
A triphasic chart, as the name suggests, shows three distinct temperature levels: low follicular phase temps, higher post-ovulation temps, and a third, even higher level of temps appearing about 7 to 10 days after ovulation. This second upward shift is believed to be caused by a secondary surge in progesterone that can occur following successful implantation.
While a triphasic pattern BBT is statistically more common in pregnancy charts, it is not a definitive sign. Some non-pregnant charts can show this pattern due to normal hormonal fluctuations, and many perfectly healthy pregnancy charts are only biphasic. It is best to consider it a promising secondary sign, but not a confirmation on its own.

The “Implantation Dip”: Fact or Fiction?
The so-called implantation dip is another popular topic in the TTC community. It refers to a single-day drop in temperature that can occur in the middle of the luteal phase, around 7 to 10 days post-ovulation. While it sounds plausible that implantation could cause a temperature dip, extensive data analysis from platforms like Fertility Friend has shown that this dip occurs with nearly the same frequency on both pregnant and non-pregnant charts. The dip is more likely caused by a mid-luteal surge in estrogen, which can briefly counteract progesterone’s effects and lower your BBT for a day.
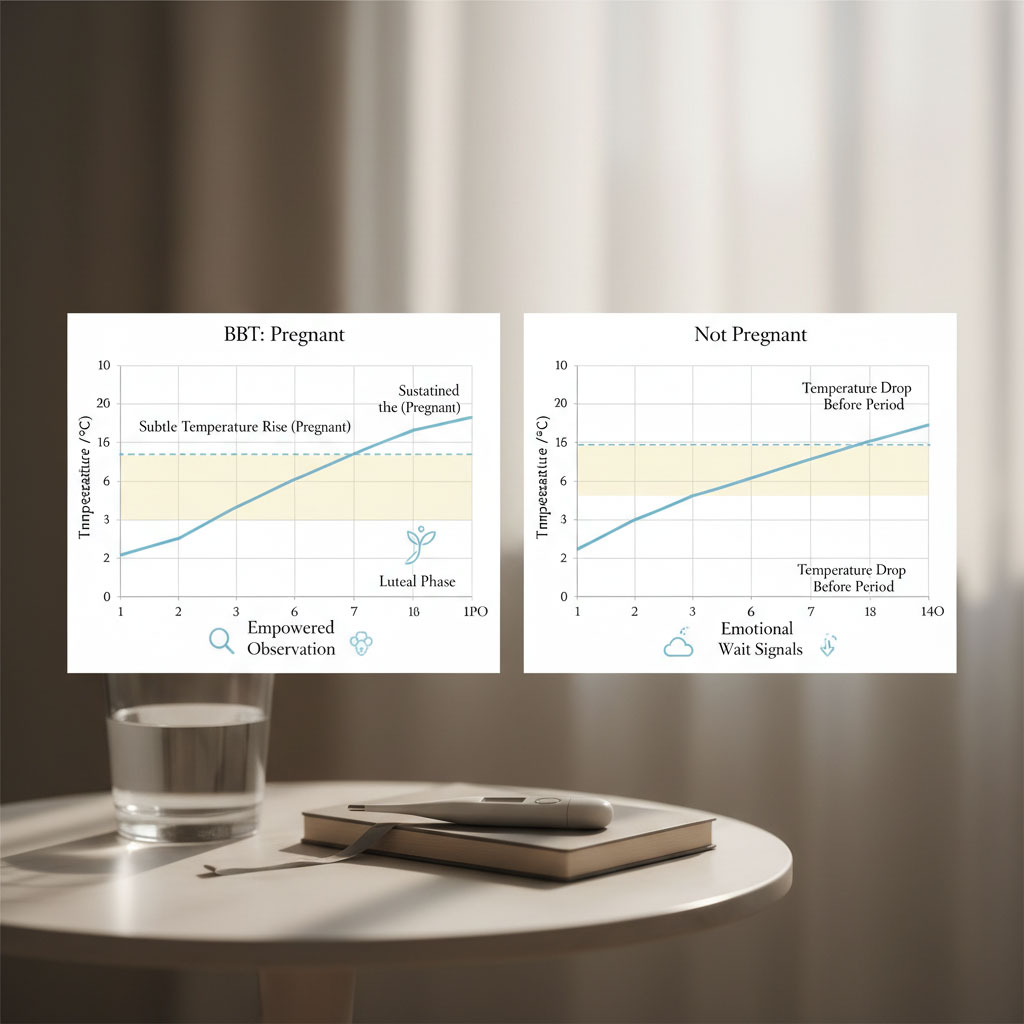
At a Glance: Pregnant vs. Non-Pregnant BBT Chart Comparison
Sometimes, a simple visual comparison is the clearest way to see the difference. The distinction between a BBT chart pregnant vs not pregnant ultimately comes down to the behavior of your temperature in the final days of your luteal phase.
| Feature | Pregnant BBT Chart Pattern | Non-Pregnant BBT Chart Pattern |
| Luteal Phase Length | Temperatures remain high for 18+ days. | Temperatures remain high for 10-16 days. |
| Temperature Before Period | No temperature drop occurs; temps stay elevated. | A sharp temperature drop occurs 1-2 days before the period starts. |
| Progesterone Levels | Remain high to support the pregnancy. | Fall sharply, triggering menstruation. |
| Common Pattern | A sustained high-temperature plateau. | A biphasic pattern with a clear end-point drop. |
| Possible Advanced Signs | May show a triphasic pattern (not guaranteed). | Can also show a triphasic pattern occasionally. |
Accuracy, Technology, and Expert Insights
While BBT charting is a powerful tool, it is important to approach it with a realistic understanding of its accuracy and how modern technology can enhance it. A proper and consistent approach to basal body temperature tracking is crucial for generating data you can trust.
How Accurate is BBT for Detecting Early Pregnancy?
BBT charting is exceptionally accurate for one specific purpose: confirming that ovulation occurred. As a tool for pregnancy confirmation BBT is a strong suggestive indicator, not a medical diagnosis. Its reliability is highest when you chart consistently and are aware of external factors that can influence your readings, such as illness, stress, poor sleep, or alcohol consumption.

A landmark study from the Stanford University School of Medicine demonstrated the immense power of continuous temperature monitoring. Researchers found that wearable sensors could detect physiological changes consistent with pregnancy, on average, nine days before a missed period, highlighting the incredible value of temperature data in early detection.
Modern Tools: Apps and Wearables
Technology has completely revolutionized basal body temperature tracking. While a simple pen and paper chart work, digital tools can offer deeper insights and greater convenience.
Apps like Premom, Fertility Friend, and Flo use AI-driven algorithms to help you interpret your menstrual cycle temperature chart. They can automatically detect your cover line, pinpoint your ovulation shift, and highlight patterns you might otherwise miss.
Wearable sensors are another major advancement in this field. Instead of needing to wake up at the exact same time each morning for an oral temperature, these devices track your temperature continuously while you sleep. This provides a more stable and often more accurate reading that is less susceptible to minor sleep disturbances.
| Tracking Method | Pros | Cons | Best For |
| Oral BBT Thermometer | Low cost, widely available, simple to use. | Requires strict consistency (same time every morning), can be affected by poor sleep or mouth breathing. | Budget-conscious users who have a regular sleep schedule. |
| Wearable BBT Sensor | Tracks continuously overnight, eliminates the need for waking up, less affected by sleep disturbances. | Higher cost, requires nightly wear, may have a learning algorithm period. | Users with irregular sleep schedules, PCOS, or those who want maximum convenience and data. |
What the Experts Say
Medical professionals widely view BBT charting as a valuable component of fertility awareness methods. According to the Cleveland Clinic, combining BBT charting with monitoring other key fertility signs, like changes in cervical mucus, provides a more complete and reliable picture of your fertile window and overall cycle health.
Reproductive specialists often recommend charting to their patients to gather foundational data about their cycles. This data can be invaluable for identifying potential issues, such as a short luteal phase temperature pattern (a luteal phase defect), which could indicate a need for further investigation and medical support.
Your Action Plan: From Charting to Confirmation
Knowledge is only powerful when it is applied. Here is your practical guide to implementing BBT charting effectively, avoiding common mistakes, and taking the right next steps based on your early pregnancy BBT pattern.
A Step-by-Step Guide to Accurate BBT Charting
Consistency is the absolute key to a readable and reliable chart. Following these best practices will ensure you are gathering the most accurate data possible:
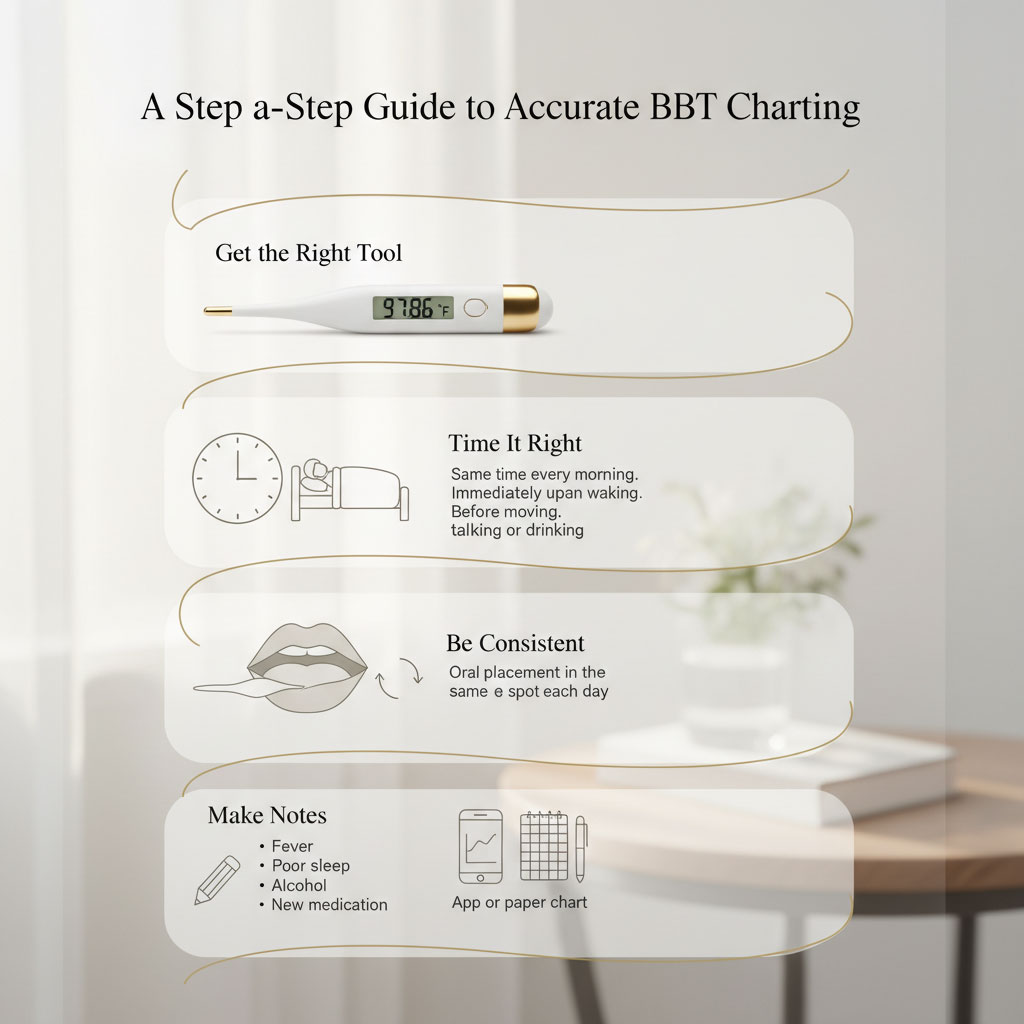
- Get the Right Tool: Use a dedicated basal body thermometer that measures to two decimal places (e.g., 97.68°F) for greater precision.
- Time it Right: Take your temperature at the exact same time every single morning, immediately upon waking. This must be done before you sit up, talk, drink, or get out of bed.
- Be Consistent: For oral readings, place the thermometer in the same spot in your mouth each day.
- Log it Immediately: Record your temperature in your chosen app or paper chart right away so you do not forget or misremember the reading.
- Make Notes: Be sure to log anything that could affect your temperature. This includes a fever, poor sleep, drinking alcohol the night before, unusual stress, or a new medication.
My BBT is High, When Should I Take a Pregnancy Test?
Seeing that sustained high temperature is incredibly exciting, but timing your pregnancy test is important to avoid the disappointment of a false negative. For the most accurate result, it is best to wait until you have recorded at least 16, and preferably 18, high temperatures in a row. At this point in your cycle, hCG levels should be high enough for a standard home pregnancy test to easily detect them.
Next Steps After a Positive BBT Pattern and Test
Once you have a positive BBT chart and a positive pregnancy test, it is time to transition from tracking to care.

- Call Your Doctor: Schedule an appointment with your healthcare provider. They will likely confirm the pregnancy with a blood test and begin your prenatal care plan.
- Continue Healthy Habits: Focus on a healthy diet, take your prenatal vitamins, and follow your doctor’s advice for a healthy pregnancy.
- You Can Stop Charting: Once your pregnancy is confirmed by a medical professional, you can put your thermometer away. Continuing to chart can sometimes cause unnecessary anxiety over minor daily fluctuations that are normal.
Summary & Key Takeaways
Navigating the path to conception is a deeply personal journey, often filled with moments of high hope and deep disappointment. Basal body temperature charting provides a unique way to connect with your body, transforming passive waiting into active, informed observation.
The core difference in a BBT chart pregnant vs not pregnant is clear and scientifically grounded in the actions of your hormones. A BBT drop before period is a reliable sign your cycle is resetting, providing clarity and closure for the month. Conversely, a sustained temperature rise after ovulation that bravely lasts for 18 days or more is one of nature’s earliest and most powerful signals of a new beginning. By learning to read these patterns, you empower yourself with knowledge, clarity, and a deeper understanding of your own remarkable fertility.
Frequently Asked Questions (FAQs)
How many days of sustained high BBT suggest pregnancy?
A sustained high temperature for 18 or more consecutive days after ovulation is considered a very strong indication of a potential pregnancy. Many women can get a positive pregnancy test after 14 to 16 days of elevated temperatures.
Can I be pregnant even if my BBT chart isn’t perfect?
Yes. An occasional anomalous temperature from illness, a late night, or poor sleep does not invalidate the whole chart. It is most important to look for the overall pattern of a sustained rise rather than focusing on a single day’s reading.
Are triphasic BBT patterns a guaranteed sign of pregnancy?
No, they are not a guarantee. While a triphasic pattern BBT is statistically more common in pregnancy charts, it can also appear in non-pregnant cycles due to normal hormonal shifts. It is a positive secondary sign but requires confirmation with a test.
Why did my BBT drop but my period hasn’t started?
It is very common for the BBT to drop one or two days before your period actually begins. If your period is significantly late after a temperature drop, it could indicate an anovulatory cycle or other hormonal irregularity worth discussing with your doctor.
Can a fever from an illness be mistaken for a pregnancy BBT pattern?
Yes, absolutely. A fever will artificially inflate your BBT, making those readings unreliable for fertility tracking. It is crucial to mark any days you are sick on your chart and disregard those high temperatures when looking for your overall pattern.
Is it possible to have a low BBT in early pregnancy?
What matters is the thermal shift relative to your own body, not the absolute numbers. If your baseline temperature is naturally low, your “high” post-ovulation temperatures might still seem low compared to others. The key is a clear and sustained rise above your personal follicular phase average.
What does an anovulatory (no ovulation) BBT chart look like?
An anovulatory chart typically looks erratic, rocky, or flat, with no clear and sustained thermal shift. The temperatures will jump up and down without the classic biphasic pattern because ovulation did not occur, and therefore progesterone was not produced to heat the body.
When should I stop tracking my BBT after a positive pregnancy test?
Most healthcare providers recommend stopping BBT tracking after your pregnancy has been confirmed by a doctor with a blood test. Continuing to chart can cause unnecessary stress over normal daily temperature fluctuations that have no bearing on the health of the pregnancy.
Can BBT predict the sex of the baby?
This is a common myth with no scientific basis. There is no evidence whatsoever that your basal body temperature patterns, timing of intercourse, or chart characteristics can predict or influence the sex of your baby.
What if my BBT is erratic and spiky but stays high?
Erratic temperatures can be caused by inconsistent wake times, mouth breathing during sleep, or hormonal fluctuations. As long as the overall trend stays elevated above your cover line after ovulation, the pattern can still be valid and indicate a sustained luteal phase.
Should I be concerned about a one-day temperature drop after a positive test?
A single temperature drop is not usually a cause for alarm, as it can be caused by many environmental or physiological factors. However, if you see a sustained drop for several consecutive days back to your follicular phase range, it is wise to contact your healthcare provider for guidance.
Does a high luteal phase temperature mean I will definitely get pregnant?
No. A high luteal phase temperature simply confirms that you have ovulated and are producing progesterone. This is a necessary and healthy condition for pregnancy to occur, but it does not guarantee that fertilization and implantation will take place.