The “Two Week Wait” is arguably the most emotionally charged period in any fertility journey. Every morning involves a quiet, high-stakes ritual where you reach for your thermometer, waiting for the soft beep that might define your entire month. You are looking for a sign. You are analyzing every subtle shift in your data, wondering if that slight temperature rise means a baby is on the way or if your cycle is simply ending.
Table of Contents
For women trying to conceive, the basal body temperature (BBT) chart is more than just a graph; it is a daily dialogue with your endocrine system. While a pregnancy test is the final judge, your body leaves biological breadcrumbs days before a urine test can turn positive. By tracking your basal body temperature (BBT), you gain a window into your hormonal health that allows you to see ovulation, confirm progesterone production, and potentially spot early signs of conception.
Understanding the subtle and overt differences in BBT chart patterns: pregnant vs not pregnant cycles can transform this anxiety into empowerment. This guide is not a cursory overview; it is a deep dive into the physiological mechanisms of fertility charting. We will explore the statistical probabilities of implantation dip bbt charts, the rarity of triphasic bbt chart pregnancy patterns, and why your temperature might stay high even when a test is negative.
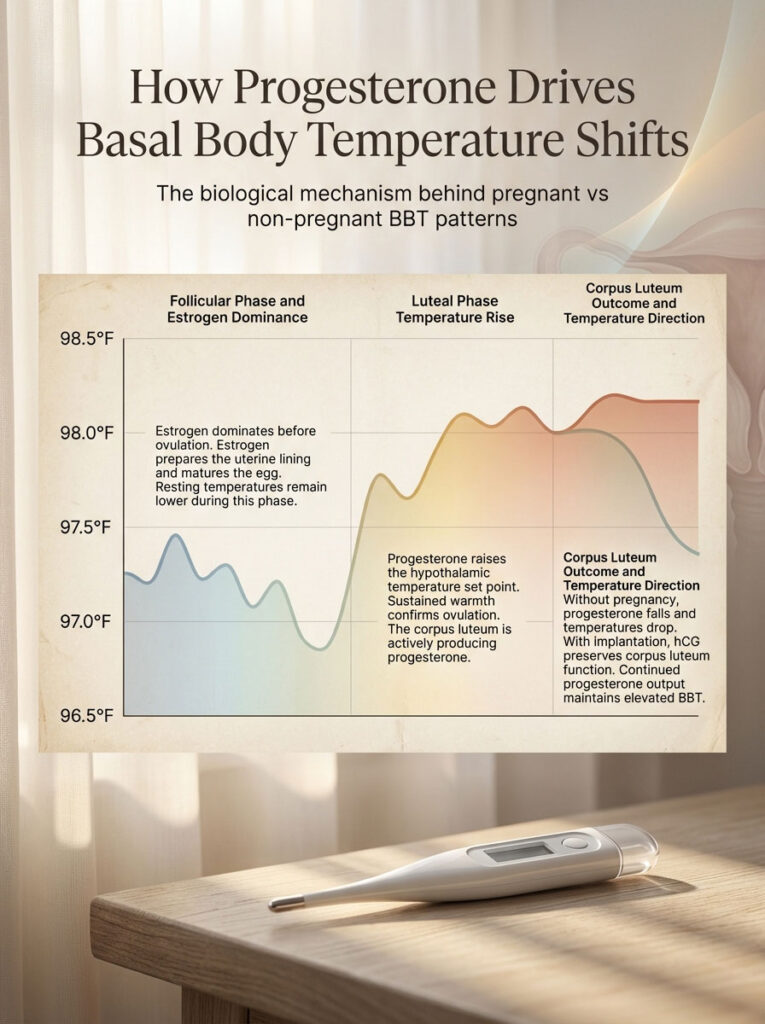
The Biological Science: How Progesterone Drives Basal Body Temperature Shifts
To accurately interpret a bbt chart pregnant vs not pregnant, you must first understand the biological mechanism that drives these temperature changes. Your body does not heat up randomly. It heats up in response to specific chemical signals sent to the hypothalamus, the part of your brain that acts as your body’s thermostat.
Understanding the Follicular Phase and Estrogen Dominance
The menstrual cycle is a dance between two primary phases, each with a distinct thermal signature. The first half is the Follicular Phase. Before ovulation, your body is dominated by estrogen, which is secreted by the developing follicles in the ovaries. This hormone prepares the uterine lining (endometrium) and matures the egg.
Crucially, estrogen has a cooling effect on the body’s resting temperature. During this phase, which lasts from the first day of your period until the moment of ovulation, your waking temperatures will typically sit lower. For most women, this baseline is in the 97.0°F to 97.5°F range, though those with slower metabolisms or thyroid variations may see temps in the high 96°F range. This relatively flat, low pattern is the canvas upon which the thermal shift will eventually be painted.
The Luteal Phase Temperature Rise and Corpus Luteum Function
Once ovulation occurs, the biological game changes instantly. The dominant follicle releases the egg and then collapses in on itself. This structure transforms into a temporary, yet vital, endocrine gland called the corpus luteum.
The corpus luteum begins pumping out progesterone, the “pro-gestation” hormone. Progesterone is thermogenic. It acts directly on the thermoregulatory center of the hypothalamus to raise the body’s set point. This causes the luteal phase temperature rise that confirms ovulation has happened. A healthy post-ovulation shift usually sees temperatures jump by 0.4°F to 1.0°F above the follicular baseline. This sustained heat is the biological proof that you have ovulated and that your body is producing enough progesterone to potentially support a pregnancy.
The Mechanism of Corpus Luteum Rescue in Conception
The fate of the corpus luteum determines whether you see a bbt chart pregnant pattern or a menstruation pattern. This gland has a pre-programmed lifespan of about 12 to 14 days. It is a ticking clock.
In a non-conception cycle, the corpus luteum realizes there is no pregnancy signal. It begins to undergo luteolysis (disintegration). As it shrinks, progesterone and basal body temperature levels crash simultaneously. This drop triggers the shedding of the uterine lining, which you experience as a period.
However, if conception occurs, the embryo travels down the fallopian tube and implants into the uterine wall. Once implanted, the developing trophoblast cells (which become the placenta) begin secreting hCG (Human Chorionic Gonadotropin). This hormone acts as a “rescue” signal. It binds to the receptors on the corpus luteum, telling it to stay alive and keep pumping out progesterone. Because the progesterone never drops, the temperature never drops. This sustained heat is the hallmark of a basal body temperature chart pregnancy.
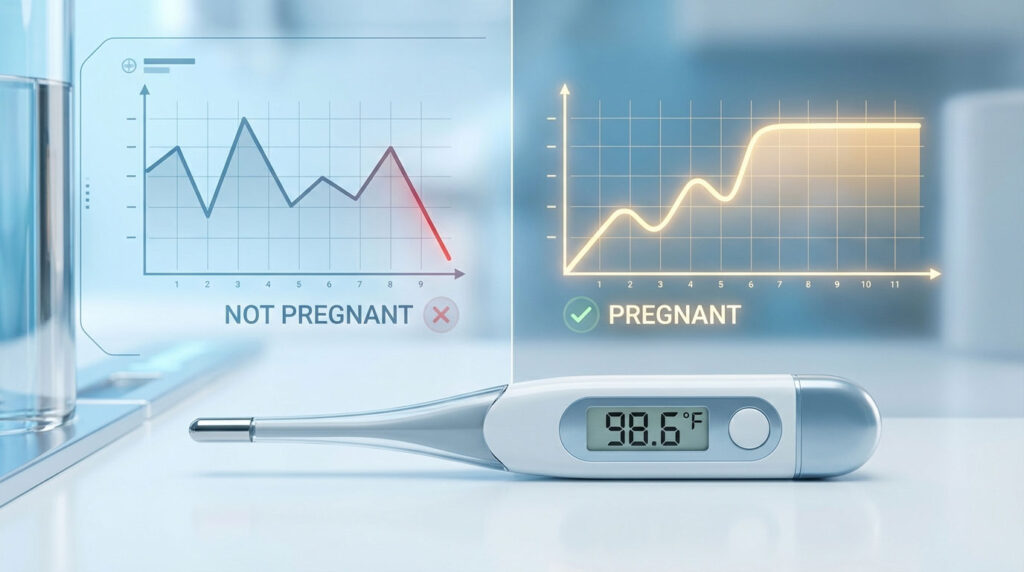
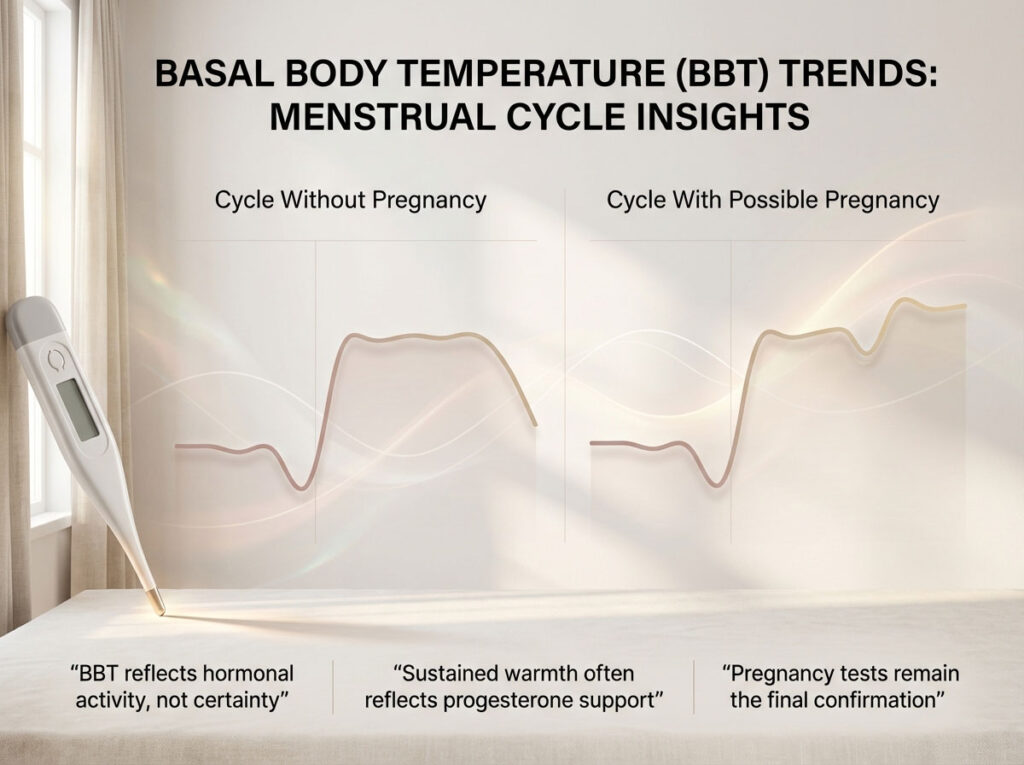
Visualizing the Difference: BBT Chart Pregnant vs Not Pregnant Examples
Recognizing the visual difference between these two outcomes is the core skill of fertility charting. While every woman is unique, and “textbook” charts are rarer than we would like, the aggregate data from millions of charts reveals distinct trends that separate a successful cycle from an unsuccessful one.
Characteristics of a Non-Pregnant Biphasic Chart
A typical ovulatory cycle that does not result in pregnancy follows a classic “Biphasic” pattern. This means the chart has two clear levels: low before ovulation and high after.
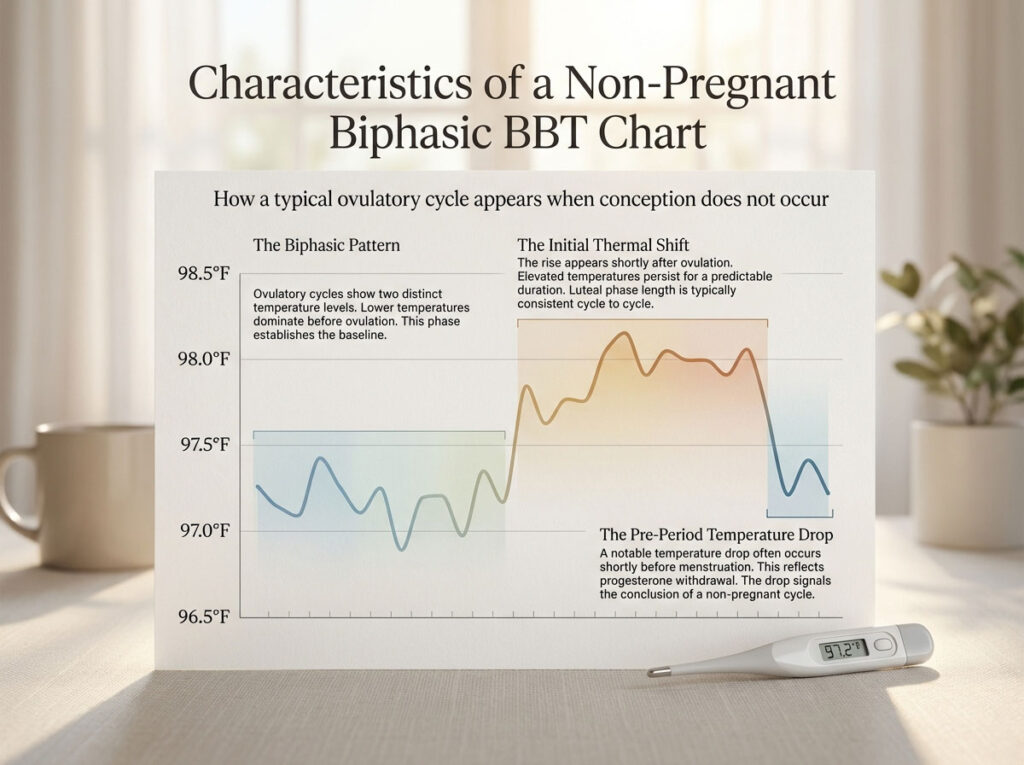
The Initial Thermal Shift
You will see the standard thermal shift one day after ovulation. The temperatures will stay elevated above the coverline (the baseline separating the two phases) for approximately 11 to 14 days. This length is usually consistent for each woman. If your luteal phase is 12 days one month, it will likely be 12 days the next.
The Pre-Period Temperature Drop
The defining feature of a bbt chart not pregnant scenario is the “cliff dive.” Approximately 24 to 48 hours before your period starts, you will likely see a significant bbt drop before period. This confirms that progesterone has left the building. In some cases, the drop happens the morning menstruation begins. Seeing this drop can be heartbreaking when trying to conceive, but it provides closure for that specific cycle, indicating that testing is likely unnecessary.
Characteristics of a Pregnant Chart (Sustained High Temperatures)
When you achieve pregnancy, the chart starts the same way but ends very differently. The pregnant bbt chart tells a story of hormonal persistence.
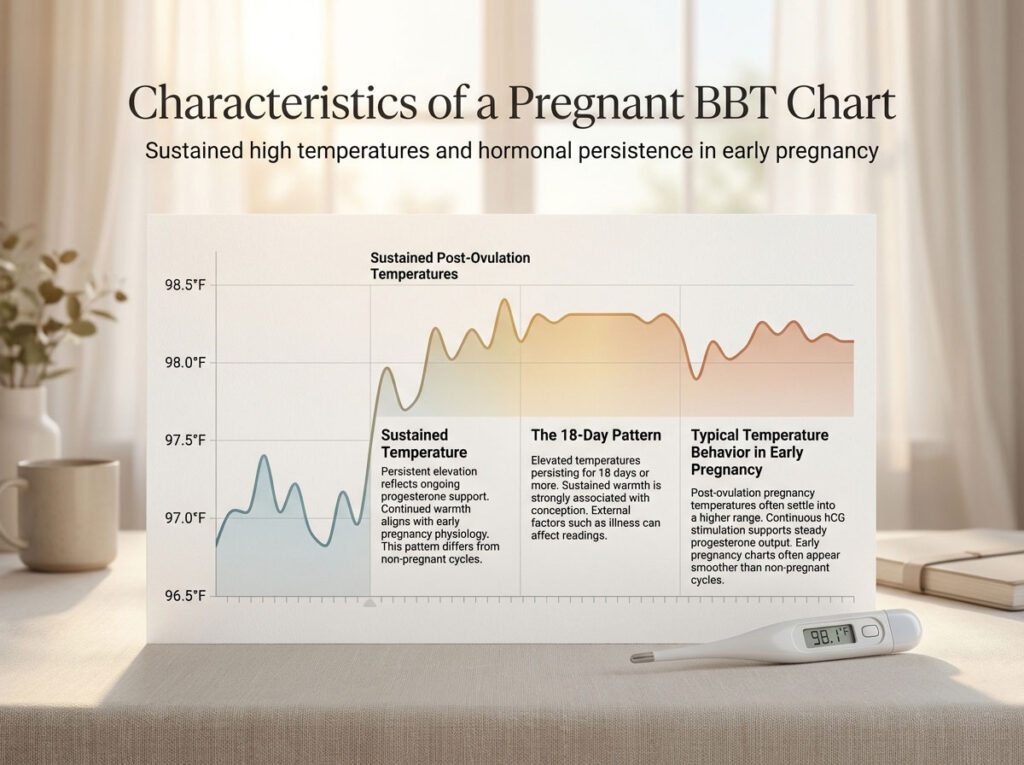
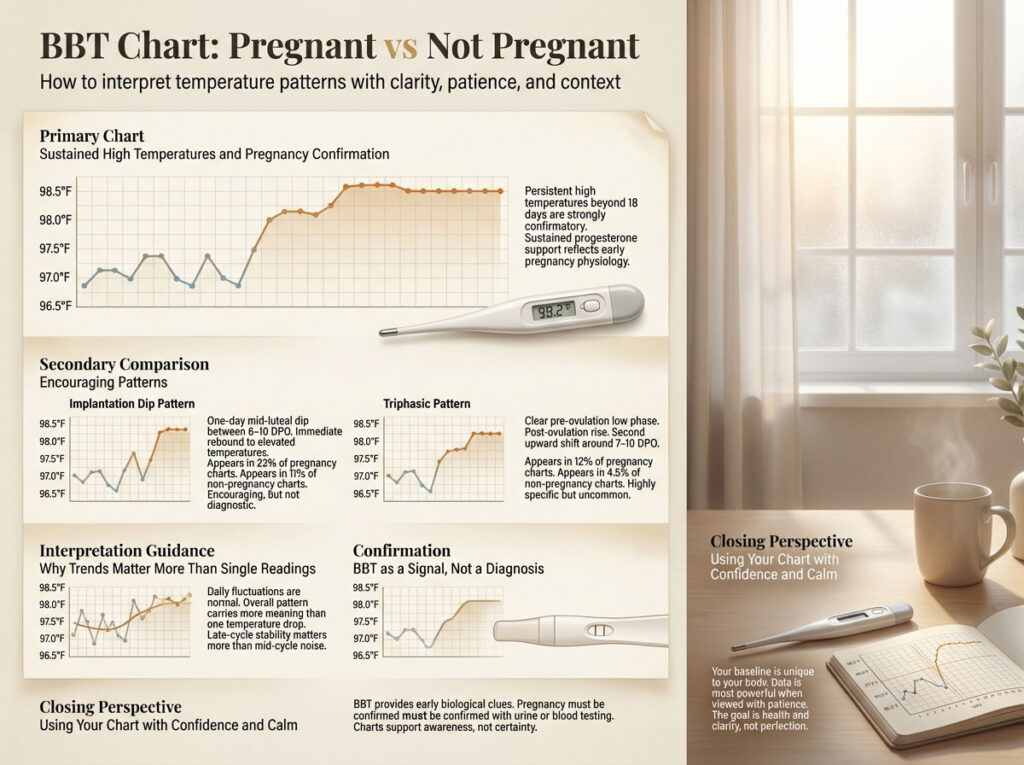
The 18-Day Rule for Early Pregnancy Detection
If you are looking for the most reliable sign, look at the duration. Clinical guidance suggests that if your BBT stays high for 18 consecutive days or more after ovulation, it is 99% confirmatory of pregnancy, provided you do not have a fever or a progesterone-secreting cyst. By the time bbt stays high 18 days, it is almost biologically impossible for the cycle to be non-pregnant. This sustained elevation is often the very first early pregnancy bbt chart sign, appearing even before some urine tests turn a strong positive.
Average Temperature Ranges in Early Pregnancy
Many women ask, “What is the specific temperature of a pregnant bbt chart?” While individual baselines vary, post-ovulation pregnancy temperatures often stabilize in a higher bracket. You will commonly see readings between 97.6°F and 98.6°F. Crucially, the chart often looks smoother. Because hCG is constantly stimulating the corpus luteum, the progesterone output is steady, leading to less jagged temperature variances compared to the end of a non-pregnant cycle.
Comparative Analysis: Key Features of Pregnant vs Non-Pregnant Charts
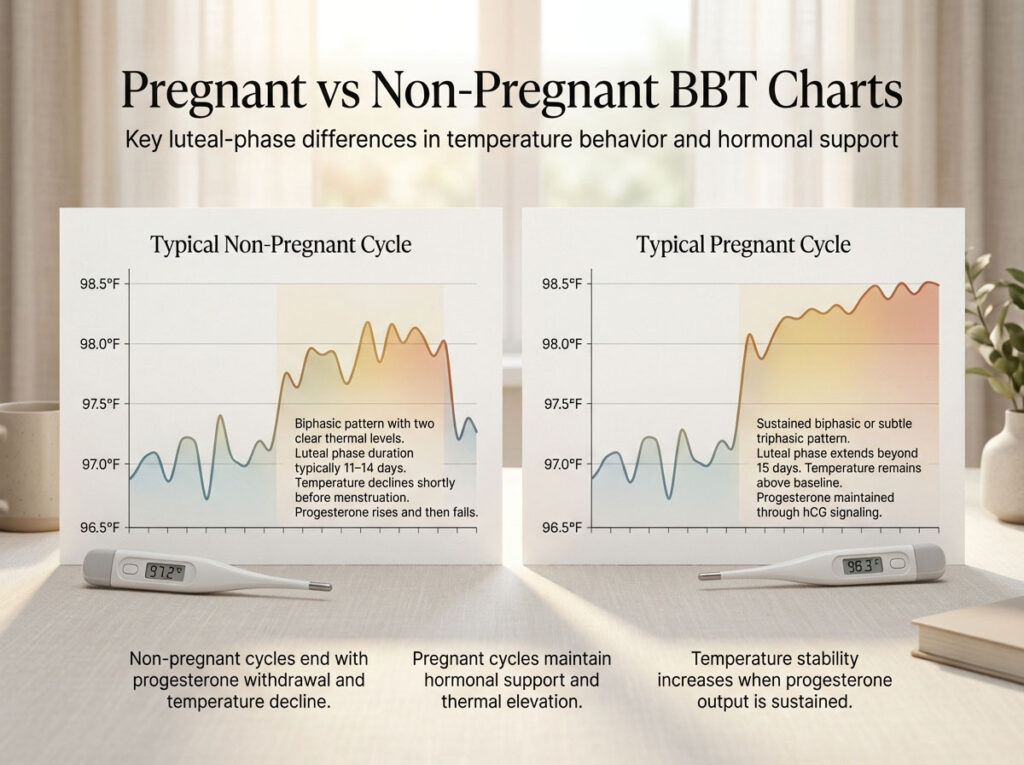
To help you visualize these differences, the table below outlines the specific characteristics you should look for when analyzing your luteal phase.
| Feature | Non-Pregnant Cycle (Typical) | Pregnant Cycle (Typical) |
| Pattern Type | Biphasic (Two distinct phases) | Biphasic (Sustained) or Triphasic |
| Luteal Phase Length | 11–14 days (fixed per woman) | Extends beyond 15+ days |
| End of Cycle Trend | Temperature drops 24–48 hours before flow | Temperature remains elevated (above coverline) |
| Average High Temp | 97.6°F–98.2°F (drops at end) | 97.8°F–98.6°F (sustained) |
| Key Hormonal Driver | Progesterone peaks then crashes | Progesterone maintained by hCG |
| Variability | May become jagged/erratic near period | Often stabilizes or rises slightly |
Analyzing the Implantation Dip BBT Chart: Is the 7 DPO Drop Reliable?
Beyond the basics, the charting community is often obsessed with “micro-signs.” These are subtle patterns that appear during the luteal phase. The most discussed of these is the implantation dip bbt chart pattern.
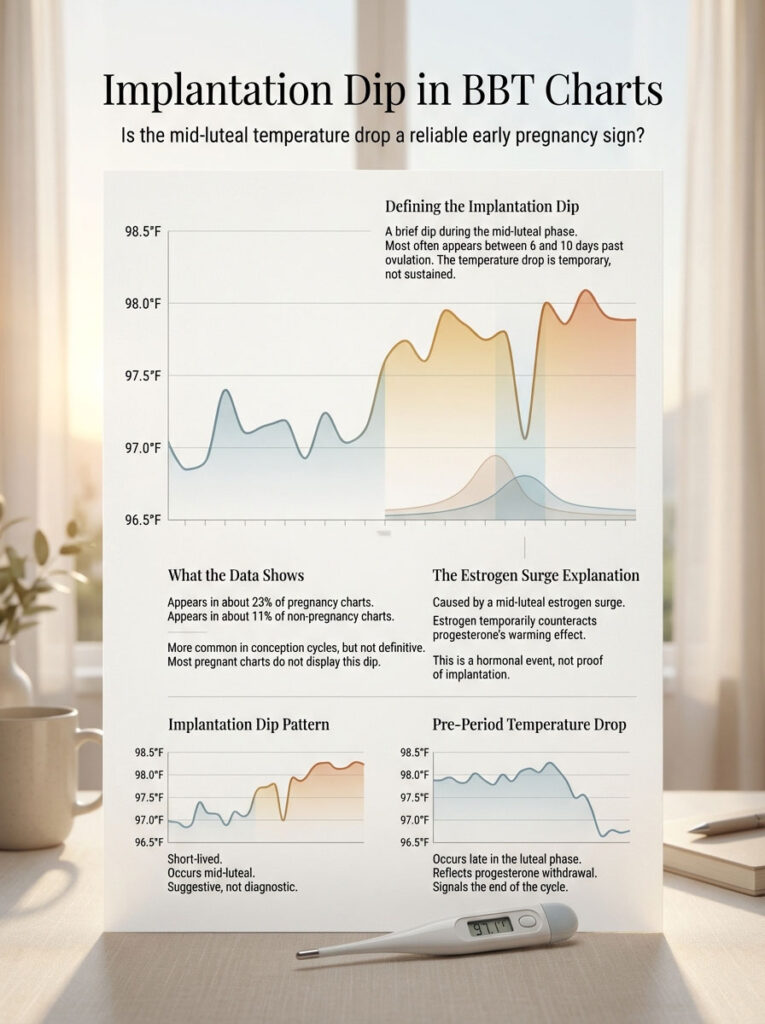
Defining the Implantation Dip Phenomenon
You may have heard that a temperature drop around 7 days past ovulation (7 DPO) confirms pregnancy. This phenomenon appears as a one-day drop that dips toward or below the coverline, only to bounce back up the next day. It typically occurs between 6 DPO and 10 DPO, coinciding with the implantation window.
Statistical Reliability: What the Data Says
The data on this is fascinating but mixed. According to large-scale analyses from fertility apps like Fertility Friend, strictly defined implantation dips appear in 23% of pregnancy charts.
However, they also appear in 11% of non-pregnancy charts.
What does this mean for you? It means that if you see a dip, your odds are better. An implantation dip bbt chart is statistically twice as likely to belong to a pregnant woman than a non-pregnant one. However, it is not a guarantee. The vast majority of pregnant charts (77%) do not show this dip at all.
The Estrogen Surge Mechanism
Why does the dip happen? It is likely not caused by the physical act of the embryo attaching. Instead, it is caused by a secondary surge of estrogen.
During the mid-luteal phase, the corpus luteum secretes a wave of estrogen alongside progesterone. Since estrogen has a cooling effect, a strong surge can temporarily override the warming effect of progesterone, causing a one-day temperature drop. Because estrogen levels are often higher in conception cycles, this “estrogen dip” is more frequent in pregnancy, but it is technically a hormonal event, not a mechanical implantation event. Therefore, is implantation dip a reliable sign of pregnancy? It is a positive hint, but not a diagnosis.
Comparison: Implantation Dip vs. Period Drop
It is easy to confuse a mid-cycle dip with the start of a period. The table below clarifies how to distinguish an implantation dip from the dreaded pre-menstrual drop.
| Characteristic | Implantation Dip | Pre-Period Drop |
| Timing | 7–10 Days Past Ovulation (DPO) | 12–16 DPO (1–2 days before bleed) |
| Duration | Usually 1 day (bounces back immediately) | Sustained drop (stays low as period starts) |
| Depth | Often dips to or slightly below coverline | Drops significantly below luteal average |
| Cause | Estrogen surge (mid-luteal) | Corpus luteum disintegration |
| Pregnancy Likelihood | Suggestive (23% of pregnancy charts) | Very Low (signals end of cycle) |
Decoding the Triphasic BBT Chart Pregnancy Pattern and Success Rates
The “Holy Grail” of fertility charts is the triphasic bbt chart pregnancy pattern. This occurs when the chart shows three distinct levels of temperatures rather than the usual two.
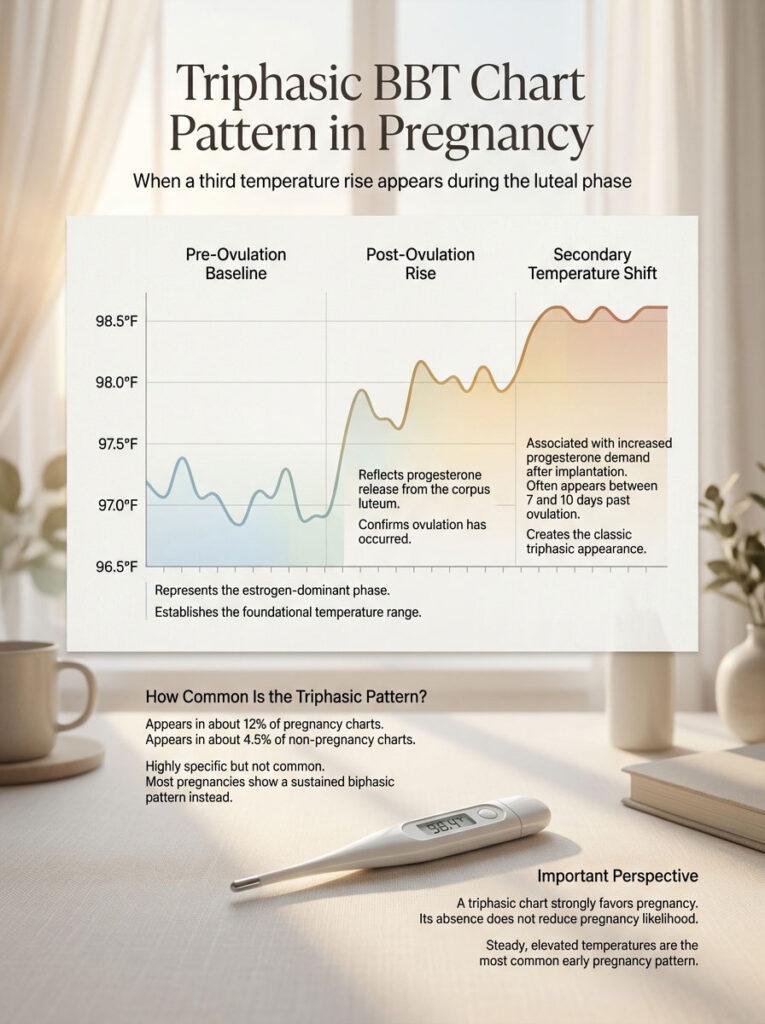
What is a Triphasic Temperature Shift?
A standard chart is biphasic:
- Phase 1: Low temps (Pre-ovulation).
- Phase 2: High temps (Post-ovulation).
A triphasic chart adds a third level:
3. Phase 3: Even Higher temps (Starting around 7–10 DPO).
This second thermal shift happens because the implanted embryo triggers a massive ramp-up in progesterone production to support the new life, warming the body even further.
Statistics and Probability of Triphasic Shifts
The statistics here are compelling. A triphasic bbt chart pregnancy pattern occurs in 12% of pregnancy charts. Conversely, it appears in only 4.5% of non-pregnancy charts.
This makes the triphasic pattern highly specific. If you see it, there is a very strong chance you are looking at a pregnant bbt chart. However, it has low sensitivity. This means that most women who are pregnant will never see a triphasic chart. They will have a standard biphasic chart that just stays high.
Expert Note: Do not lose hope if your chart does not look triphasic. It is the exception, not the rule. A steady, biphasic chart is the most common presentation of a healthy pregnancy.
Troubleshooting High BBT But Negative Pregnancy Test (High BBT BFN)
Few things are more confusing than seeing a perfect bbt chart pregnant pattern—high temperatures, maybe even a triphasic shift—but getting a negative test result (BFN). If you search for why is my bbt still high but negative pregnancy test, you are likely frustrated and confused. There are four primary medical reasons this happens.
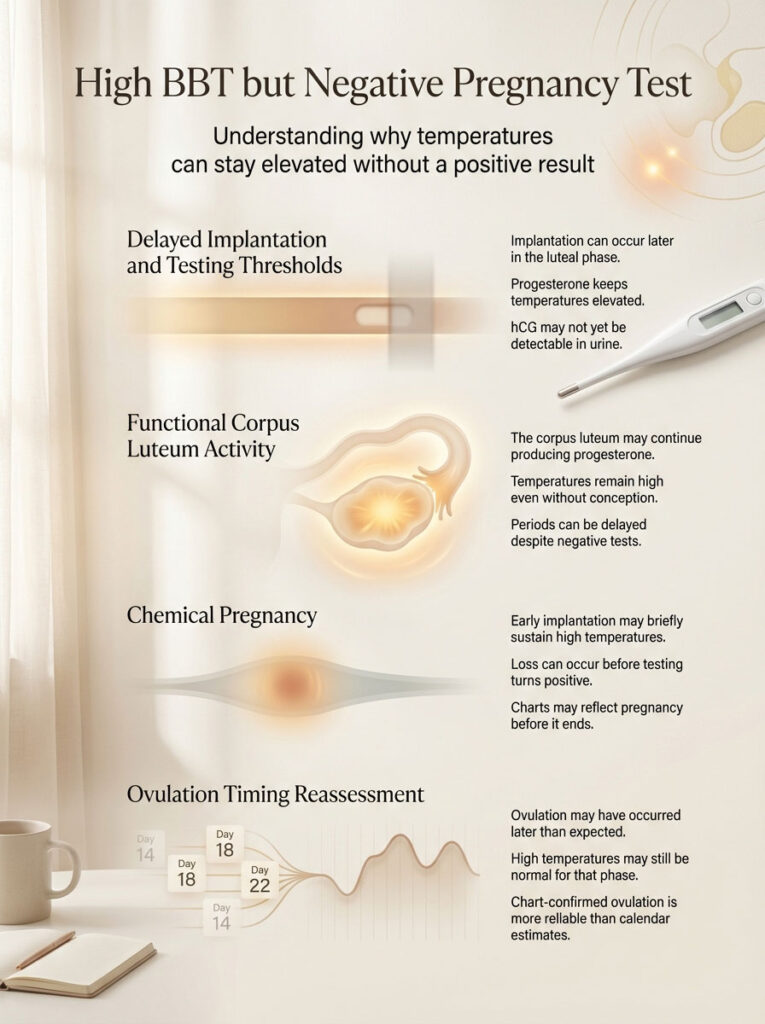
1. Delayed Implantation and hCG Thresholds
Implantation usually happens between 6 and 12 DPO. If implantation occurs late (e.g., 11 or 12 DPO), your body will keep your temperature high because the rescue signal has been sent. However, the hCG levels may not yet be high enough to trigger a urine test. It takes about two days after implantation for hCG to reach detectable levels in urine. In this case, your early pregnancy bbt chart is correct, but your test is simply too early.
2. Functional Corpus Luteum Cysts
Sometimes, a corpus luteum does not disintegrate on schedule even though you are not pregnant. It can form a fluid-filled cyst known as a functional corpus luteum cyst. This cyst continues to produce progesterone, keeping temps high and delaying a period even without pregnancy. This mimics a pregnant bbt chart perfectly—high temps and no period—but there is no embryo. These cysts usually resolve on their own, but they can delay your period by weeks.
3. Chemical Pregnancy
This is a painful reality for many trackers. A chemical pregnancy is a very early miscarriage. The embryo implants briefly, signaling the body to keep temps high, but fails to develop shortly after. You might see 16 or 17 days of high temps followed by a late, heavy period. The chart was accurately reflecting a pregnancy, but the loss occurred before or right as testing became possible.
4. Calculation Error (Ovulation Timing)
You may have ovulated later than you thought. If your app predicted ovulation on day 14, but you actually ovulated on day 17, you are not “late” yet; you are just earlier in your luteal phase than you realized. This is why confirming ovulation with bbt chart patterns is superior to relying on calendar-only apps.
External Factors Affecting Basal Body Temperature Accuracy
Before you panic or celebrate, consider factors affecting basal body temperature. BBT is sensitive. External variables can cause “fake” high temperatures that mess up your bbt chart pregnant vs not pregnant analysis.
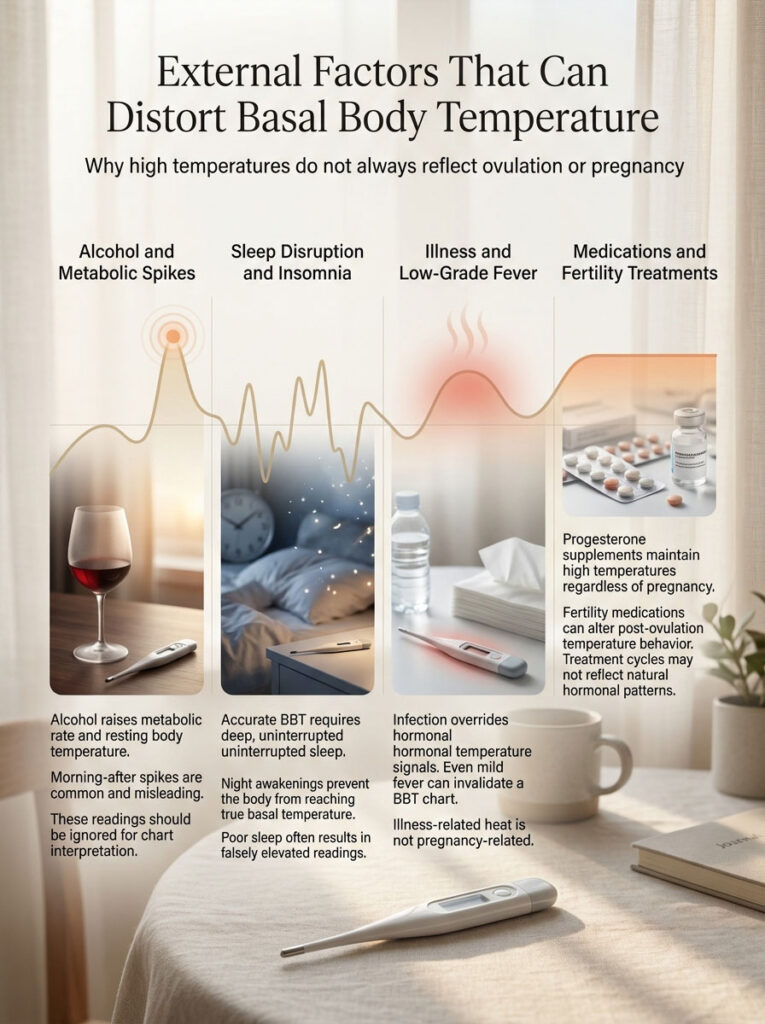
Alcohol Consumption and Metabolic Spikes
Drinking the night before is the number one cause of false spikes. Alcohol increases metabolic rate and body temperature. A sharp spike the morning after a wine night is not an ovulation shift or a triphasic pattern; it is a metabolic reaction. If you see a random high temp after drinking, mark it as “discarded” in your app to avoid confusing the algorithm.
Sleep Disruption and Insomnia
You need at least three consecutive hours of deep, resting sleep for an accurate reading. Waking up to use the bathroom at 3 AM and temping at 6 AM can alter results. If you toss and turn all night, your body temperature never fully drops to its basal level, leading to a falsely high reading the next morning.
Illness and Low-Grade Fevers
Even a low-grade fever overrides all hormonal patterns. If you have a cold, flu, or infection, your BBT chart becomes unusable for that duration. A temp of 99.0°F or higher is almost always illness-related, not pregnancy-related, as progesterone rarely pushes BBT that high on its own.
Medications and Fertility Treatments
If you are undergoing fertility treatments, your chart may be artificial.
- Progesterone Supplements: If you are taking progesterone suppositories (like Prometrium) after ovulation, your temperature will remain high artificially. You cannot use your chart to test for pregnancy, as the medication is creating the luteal phase temperature rise.
- Trigger Shots (hCG): These do not affect temp directly but ensure ovulation timing.
- Clomid/Letrozole: These can sometimes cause higher-than-average post-ovulation temperatures due to stronger ovulation.
Tools, Technology, & Best Practices for Fertility Charting
To reliably spot an early pregnancy bbt chart, you need precision. Using a standard fever thermometer found in a drug store simply won’t cut it.
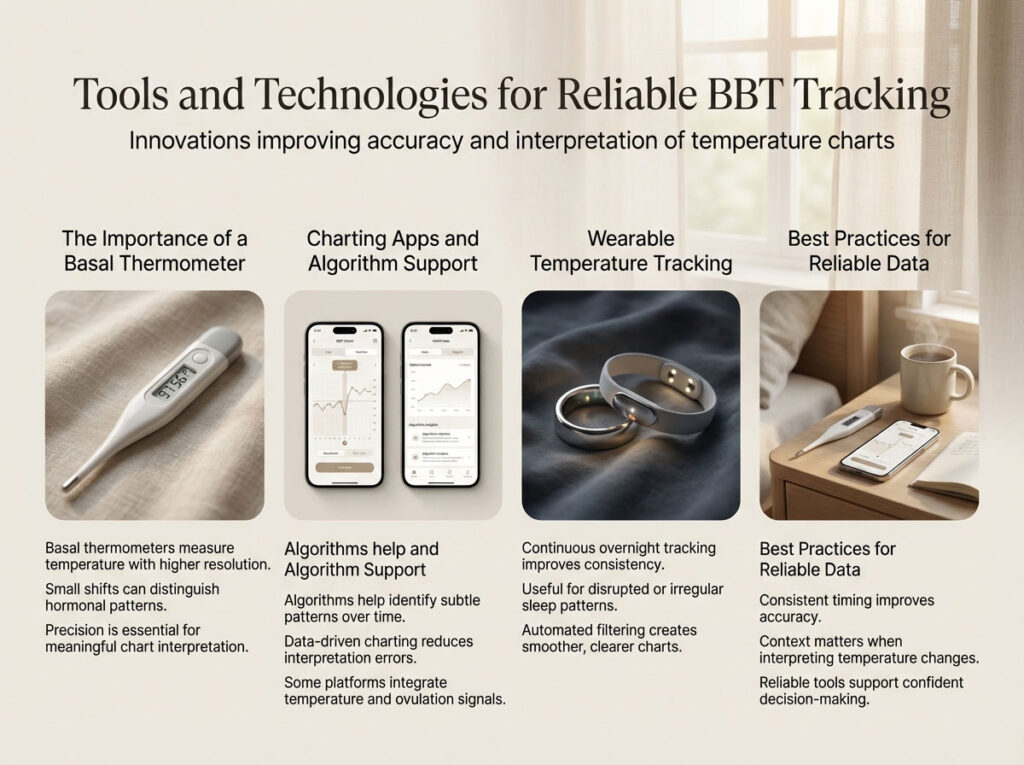
Essential Gear: The Basal Thermometer
You must use a specific basal thermometer. These devices measure to two decimal places (e.g., 97.56°F). This precision is vital because the difference between a pregnant and non-pregnant reading can be as small as 0.2 degrees. A standard thermometer that rounds to 97.6°F misses the nuance of the shift.
Algorithm Accuracy: Apps to Trust
While you can chart on paper, algorithms help reduce human error.
- Fertility Friend: Widely regarded as the “gold standard” for serious charterers. Its algorithm is conservative and data-driven, excellent for identifying the bbt chart pregnant vs not pregnant difference without giving false hope.
- Premom: Excellent for users who also use OPK (ovulation predictor kit) strips, as it allows you to photograph tests alongside your temp chart to see the correlation between LH surges and temp rises.
- Flo / Clue: Good for general tracking, but sometimes less customizable for complex BBT patterns compared to Fertility Friend.
Wearable Tech: Tempdrop and Oura
For women with irregular sleep (nursing moms, shift workers, or insomniacs), an oral thermometer is often inaccurate. Wearable devices like Tempdrop or the Oura Ring measure temperature continuously throughout the night. They use algorithms to filter out disturbances and provide a “true” basal reading. Charts from these devices are often smoother and easier to read than oral BBT charts.
When to Seek Medical Advice About Your Chart Patterns
Your BBT chart is a health record. It can reveal issues beyond just pregnancy status.
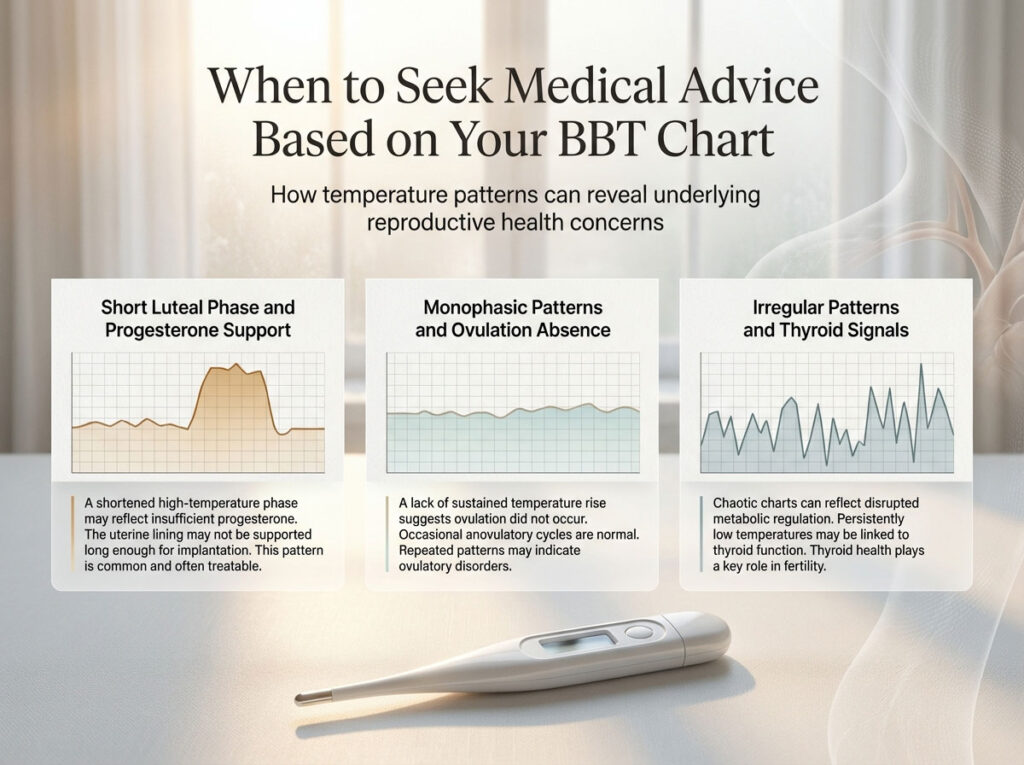
Identifying Luteal Phase Defects
If your temps drop and your period starts fewer than 10 days after ovulation, you may have a luteal phase defect. This means the corpus luteum is not producing enough progesterone to sustain a lining long enough for an embryo to implant. This is a common, treatable cause of infertility.
Recognizing Anovulatory Cycles
If your chart is “monophasic”—meaning it stays in the 97.0°F–97.5°F range all month with no sustained shift—you likely did not ovulate. It is normal to have an anovulatory cycle occasionally (especially under stress), but if this persists for multiple cycles, it is a reason to see a doctor to check for PCOS or other ovulation disorders.
Thyroid Red Flags
If your chart looks like a mountain range with no clear pattern, and you are using a reliable thermometer, it could indicate thyroid issues. Consistently low temperatures (below 97.0°F even after ovulation) can be a sign of hypothyroidism, which can impact fertility.
Summary: Key Takeaways for the Two Week Wait
Navigating the bbt chart pregnant vs not pregnant comparison requires patience and a good understanding of your own body’s baseline.
- The 18-Day Rule is King: If bbt stays high 18 days, you are almost certainly pregnant.
- Context Matters: An implantation dip bbt chart or a triphasic bbt chart pregnancy pattern are encouraging signs (23% and 12% probability, respectively), but their absence does not mean you are out.
- Trend Over Data Points: Do not obsess over a single day’s drop. Look for the overall pattern.
- Confirm with Testing: BBT hints at pregnancy; it does not diagnose it. Always confirm with a home pregnancy test or blood work.
Your chart is a powerful tool. Use it to listen to your body, but try not to let the daily fluctuations steal your peace of mind. Trust the data, but remember that the ultimate goal is a healthy pregnancy, not just a perfect chart.
Frequently Asked Questions (FAQ)
What does a pregnant BBT chart look like compared to a non-pregnant one?
A pregnant bbt chart typically shows a biphasic pattern where the temperature remains elevated above the coverline for 18 days or more. Unlike a non-pregnant chart, it does not show the characteristic temperature drop 1–2 days before the expected period. The temperatures often stabilize between 97.6°F and 98.6°F due to sustained progesterone.
Can I have an implantation dip and NOT be pregnant?
Yes. While an implantation dip bbt chart pattern is more common in pregnancy cycles (occurring in roughly 23% of them), it also appears in about 11% of non-pregnant charts. It can be caused by a mid-luteal estrogen surge unrelated to conception.
How many days of high temperatures confirm pregnancy?
Clinical data suggests that 18 consecutive days of elevated temperatures (high phase) after ovulation is 99% confirmatory of pregnancy, assuming the absence of illness or fever.
Why did my temperature drop at 7 DPO?
A drop at 7 DPO is often called an “implantation dip,” but it can also be a secondary estrogen surge. Estrogen lowers body temperature. If the corpus luteum releases a burst of estrogen mid-cycle, your temp may dip briefly before progesterone pushes it back up.
Can I be pregnant if my chart is not triphasic?
Absolutely. A triphasic bbt chart pregnancy pattern is rare, occurring in only about 12% of pregnancy charts. The vast majority of pregnant women have a standard biphasic chart (two levels) that simply stays high without a third shift.
Does BBT always stay high after conception?
Generally, yes. The hormone progesterone helps maintain the pregnancy and keeps the body temperature elevated. If progesterone levels drop significantly, it can indicate a risk of miscarriage or a chemical pregnancy, though minor daily fluctuations are normal.
Can alcohol or lack of sleep cause a false pregnancy sign on my chart?
Yes. Alcohol consumption and sleep deprivation (less than 3 hours) can cause artificial temperature spikes. This might make your chart look like it is staying high or going triphasic when it is actually just a reaction to lifestyle factors.
What is the difference between a coverline and a thermal shift?
The thermal shift is the actual physical rise in temperature that happens after ovulation. The coverline is a visual tool (a horizontal line) drawn on the chart to separate pre-ovulation low temps from post-ovulation high temps, helping you see the pattern clearly.
Why is my BBT high but I got a BFN (Negative Test)?
You may have ovulated later than you calculated, meaning you are not as far along as you think. Alternatively, you could have a functional corpus luteum cyst keeping progesterone high, or you may be experiencing a chemical pregnancy where hormone levels are dropping but haven’t fully reset.
How accurate is BBT for predicting pregnancy before a missed period?
BBT is better at confirming the cycle history than predicting the future instantly. However, if you see a triphasic temperature shift or an implantation dip, it increases the statistical probability of pregnancy before a missed period, though it is not a guarantee.
Is the Premom app accurate for detecting pregnancy patterns?
The Premom app uses smart algorithms to interpret your data. It is highly accurate at digitizing your chart, but the accuracy of the prediction depends entirely on your consistency in measuring your temperature at the same time every morning.
Should I stop charting once I get a positive pregnancy test?
Many experts recommend stopping once pregnancy is confirmed to avoid unnecessary anxiety. Minor temperature fluctuations are normal in pregnancy, but seeing a random drop on a chart can cause panic despite the pregnancy being healthy.
Disclaimer:
The information provided in this article is for educational purposes only and does not constitute medical advice, diagnosis, or treatment. Basal body temperature charting is a method of fertility awareness but is subject to user error and external factors. Always consult with a qualified healthcare provider or OBGYN regarding fertility concerns, pregnancy confirmation, or interpretation of your specific medical data.
References:
- Fertility and Sterility Journal: Analysis of luteal phase temperature patterns and progesterone correlation.
- American College of Obstetricians and Gynecologists (ACOG): Fertility awareness-based methods and ovulation tracking.
- NCBI / PubMed: Clinical studies on basal body temperature variations, triphasic patterns in conception, and corpus luteum function.
- PLOS Digital Health: Large-scale analysis of BBT patterns in pregnancy vs. non-pregnancy cycles using wearable fertility trackers.