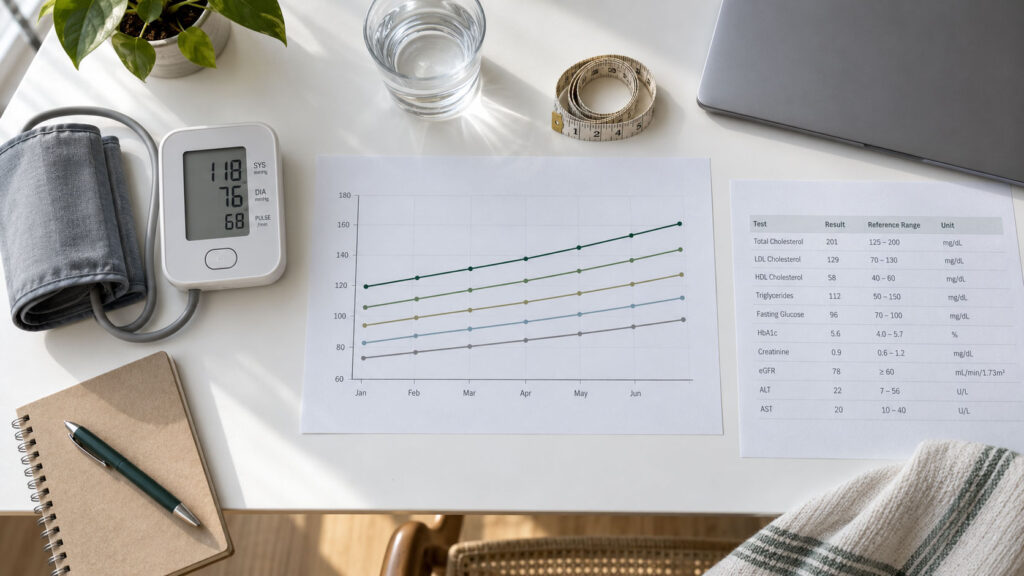
Your stress response is not the thing that hurts you. The failure to switch it off is.
That single distinction sits at the center of one of the most useful frameworks in modern stress science, and it explains why two people can survive the same brutal year and walk out of it with completely different bloodwork.
Table of Contents
Quick Answer: Allostatic load is the cumulative wear and tear your body absorbs when the stress response stays switched on too often, too long, or fails to shut down properly. Coined by Bruce McEwen and Eliot Stellar in 1993, it describes damage building across several body systems at once, including hormones, immune function, blood pressure, blood sugar, and cholesterol, long before any single disease is diagnosed.
At a Glance
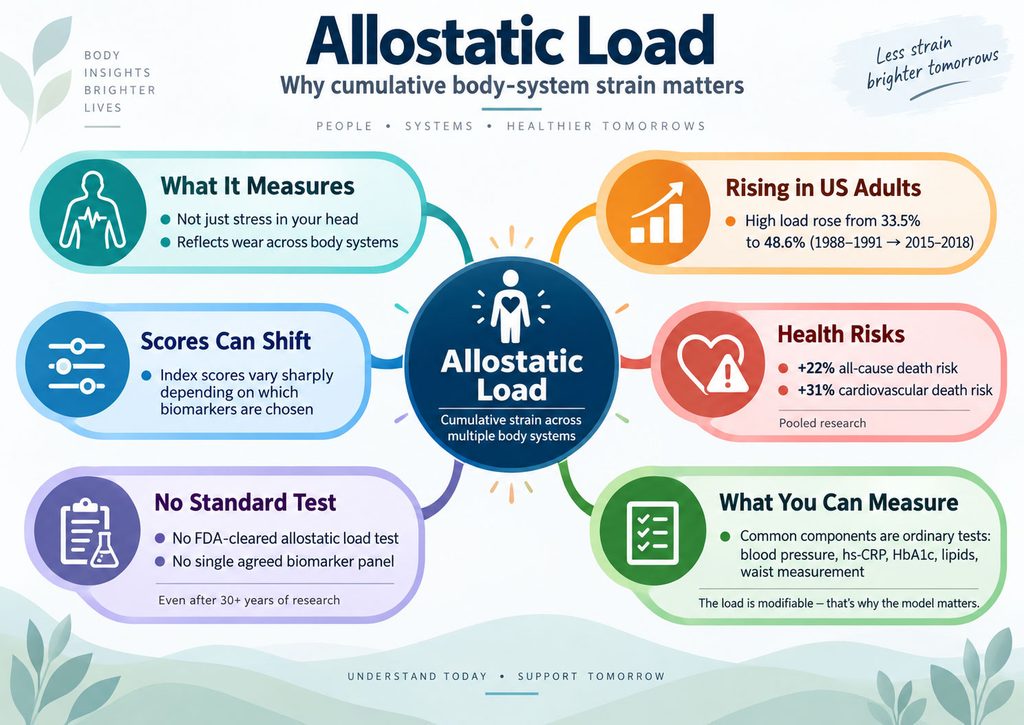
- Allostatic load measures cumulative strain across multiple body systems, not stress in your head.
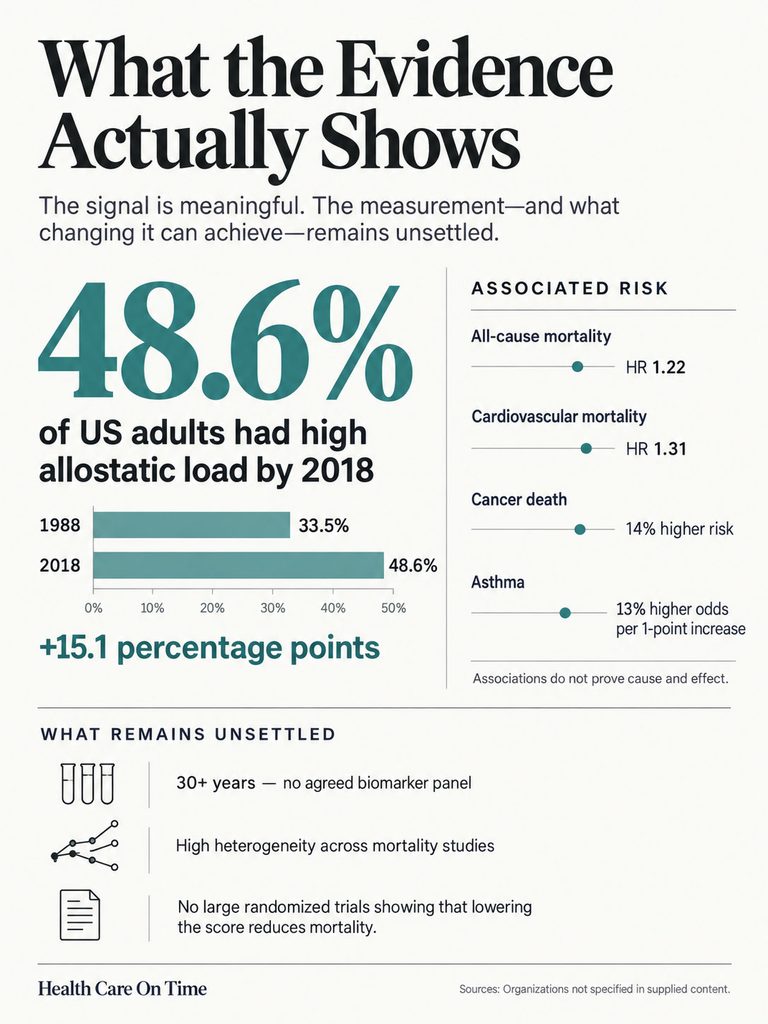
- High allostatic load among US adults climbed from 33.5% to 48.6% between 1988-1991 and 2015-2018.
- Pooled research links high allostatic load to a 22% higher all-cause death risk and 31% higher cardiovascular death risk.
- There is no FDA-cleared allostatic load test, and no single agreed biomarker panel exists after 30-plus years of research.
- Allostatic load index scores vary sharply depending on which biomarkers researchers pick.
- The individual components (blood pressure, hs-CRP, HbA1c, lipids, waist measurement) are ordinary tests you can already get.
- The load is modifiable, which is what makes the model worth understanding at all.
What Allostatic Load Actually Means
Most people meet the word “homeostasis” in high school biology and never think about it again. It deserves a second look, because everything else here builds on it.
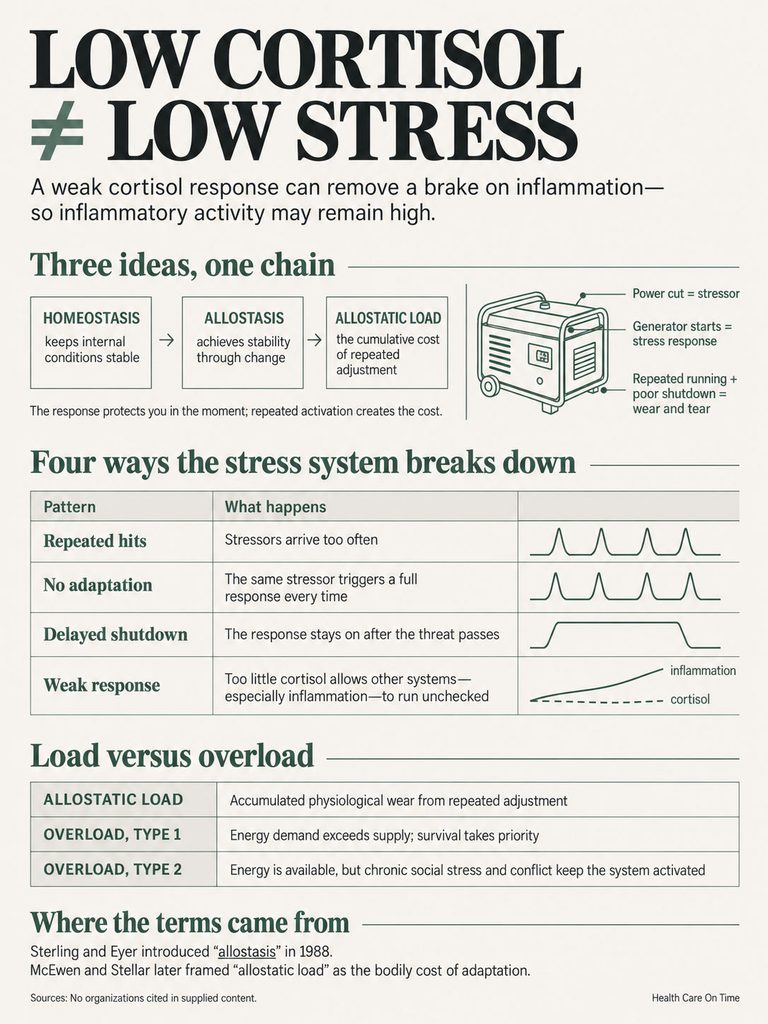
Homeostasis is your body’s ability to snap back to a fixed set point after something knocks it off course. Body temperature, blood pH, heart rate. Push them, and negative feedback pulls them home.
Allostasis is different, and the difference matters. Allostasis is stability achieved through change, meaning your body deliberately moves the set point to meet a demand. Your blood pressure rises before you stand up, not after.
Allostatic load is the bill for all that moving around. It is what accumulates when the adjustments never stop.
Homeostasis, Allostasis, and Allostatic Load in Plain English
Think of your stress systems as a household generator. Homeostasis is the thermostat keeping the house at a steady temperature. Allostasis is firing up the generator during a storm, which is exactly what it was built for.
Allostatic load is what happens when the generator runs for four years straight. Nothing dramatic breaks on day one. The wear shows up in the bearings, the fuel lines, the wiring.
The parallel holds because the body is doing the same thing. Cortisol, adrenaline, and inflammatory signaling are protective in short bursts and corrosive when they never stand down.
Where the Term Came From
Peter Sterling and Joseph Eyer introduced “allostasis” in 1988 to describe stability through change. Five years later, neuroscientist Bruce McEwen and Eliot Stellar attached a name to the cost side of that equation.
McEwen spent his career at Rockefeller University showing how stress mediators physically remodel the brain and body. His 1998 work in the Annals of the New York Academy of Sciences laid out the mechanics that researchers still use today.
His framing was blunt. Allostatic load is the price of adaptation, not stress itself, but what adaptation costs when it never gets a break.
The Four Ways the Stress System Breaks Down
McEwen described a normal allostatic response as three clean beats. A stressor arrives, the response fires, the response shuts off.
Then he described four ways that sequence goes wrong. The MacArthur SES and Health Network still publishes the original diagram, and it remains the clearest map of how ordinary lives turn into abnormal bloodwork.
Our medical reviewers find this table does more work than any paragraph of explanation, because most people recognize their own pattern in one of the rows.
| Response Pattern | What Is Happening | Everyday US Example | What It Feels Like | Long-Term Consequence |
| Normal response | Stress mediators rise, hold briefly, then switch off | A tough presentation on Tuesday, over by Wednesday | Keyed up, then genuinely relaxed | None; this is healthy function |
| Repeated hits | New stressors keep arriving before recovery finishes | Layoff, then a parent’s diagnosis, then a car repair, in one quarter | Never quite landing back at baseline | Sustained elevation in blood pressure and inflammatory markers |
| Lack of adaptation | The same stressor keeps producing a full response instead of dampening | Public speaking that stays terrifying after 200 talks | Dread that never dulls with repetition | Repeated cortisol surges with no habituation benefit |
| Prolonged response | The response starts normally but shuts down late | Ongoing caregiving, litigation, or job insecurity | Wired at 11 p.m., flat at 10 a.m. | Disrupted cortisol rhythm, abdominal fat gain, poor sleep architecture |
| Inadequate response | One system underperforms, so others overcompensate | Long-term burnout states with blunted cortisol output | Numb, foggy, unable to mount energy | Unchecked inflammatory activity that cortisol would normally restrain |
That last row surprises people. Low cortisol is not automatically good news, because cortisol normally acts as a brake on inflammatory signaling. When the brake weakens, the other systems run hot.
Allostatic Load Versus Allostatic Overload
Load and overload are not the same word twice. Load is the accumulating strain. Overload is the point where the accumulation tips into pathology.
McEwen and Wingfield split overload into two types. Type 1 occurs when energy demand exceeds energy supply, which pushes an organism into emergency survival mode and, in the wild, resolves when conditions improve.
Type 2 occurs when energy is plentiful but social conflict, insecurity, and chronic psychological pressure keep the systems engaged anyway. That is the version most Americans live inside, and it does not resolve on its own.
How the Damage Actually Accumulates Inside You
The allostatic load model describes a chain, not a single event. Understanding the order tells you where intervention is still cheap and where it stops being cheap.
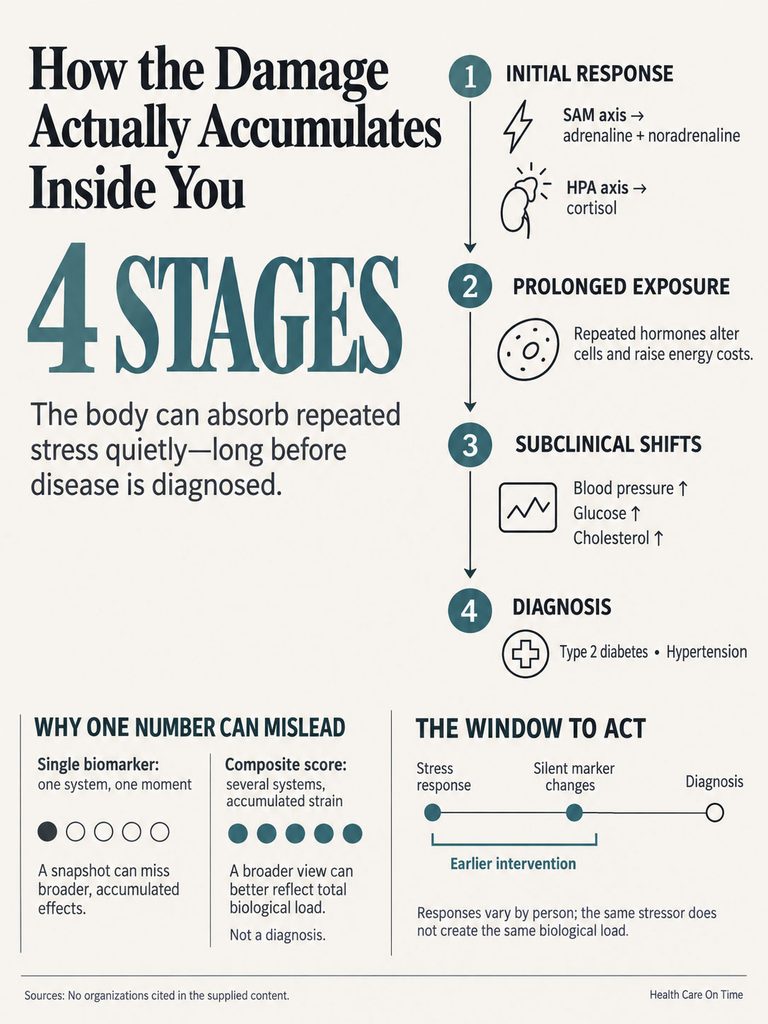
Four stages, running from hormones you cannot feel to diagnoses your doctor writes down.
Step One: Your Body Sends the First Chemical Messages
Two systems fire, one fast and one slow.
The fast one releases adrenaline and noradrenaline within seconds. Heart rate climbs, airways open, sugar pours into the bloodstream. Researchers call this pathway the sympathetic-adrenal-medullary axis, or SAM axis.
The slow one follows over minutes and releases cortisol. That pathway runs from the brain to the adrenal glands and is known as the HPA axis, short for hypothalamic-pituitary-adrenal.
Alongside these sit DHEA-S, a hormone that offsets some of cortisol’s effects, and inflammatory messengers called cytokines. Together these four groups are the primary mediators.
None of them is harmful on its own. Their pattern over months is what counts.
Step Two: Cells Start to Change
Keep any signal switched on long enough and the receiving cells stop listening. Immune cells exposed to constant cortisol gradually lose sensitivity to it, which is how a hormone meant to calm inflammation slowly loses that ability.
There is a measurable energy cost. Research published in 2023 tracked human skin cells across their full lifespan and found that long-term cortisol-type exposure raised their energy use by roughly 60%, with the cells shifting how they generate that energy.
Sixty percent more fuel burned just to hold position. That is the physical meaning of the phrase “stress is exhausting.”
Step Three: The Numbers on Your Lab Report Move
This is the stage that shows up on a printout. Blood pressure creeps upward. Fasting glucose and HbA1c drift. HDL cholesterol falls while triglycerides climb. Waist circumference expands even when overall weight looks stable.
Patients booking routine panels through HealthCareOnTime often catch this stage without meaning to. Nothing is flagged as disease, but three or four values have moved in the same direction over two years.
No single number triggers a diagnosis here. Together they describe a body under load.
Step Four: Disease Gets Diagnosed
Type 2 diabetes, hypertension, cardiovascular events, cognitive decline. The point of the model is that this stage is the end of a long process, not the beginning of a new one.
By the time a condition earns a name, stages one through three have usually been running for years.
Why Two People With the Same Job Get Different Results
Genetics, early life experience, and coping habits all shape how the same external pressure lands. So does which system happens to be your weak link.
Some people under sustained pressure develop headaches. Others develop gut symptoms. Others develop nothing visible while their metabolic markers quietly slide.
This is precisely why researchers built a composite score instead of watching one number. Tracking a single biomarker misses the person whose strain landed somewhere else entirely.
How Allostatic Load Is Measured, and Why Your Doctor Does Not Order It
Here is the part most articles skip, and it is the part readers actually need.
The Original 10-Biomarker Panel
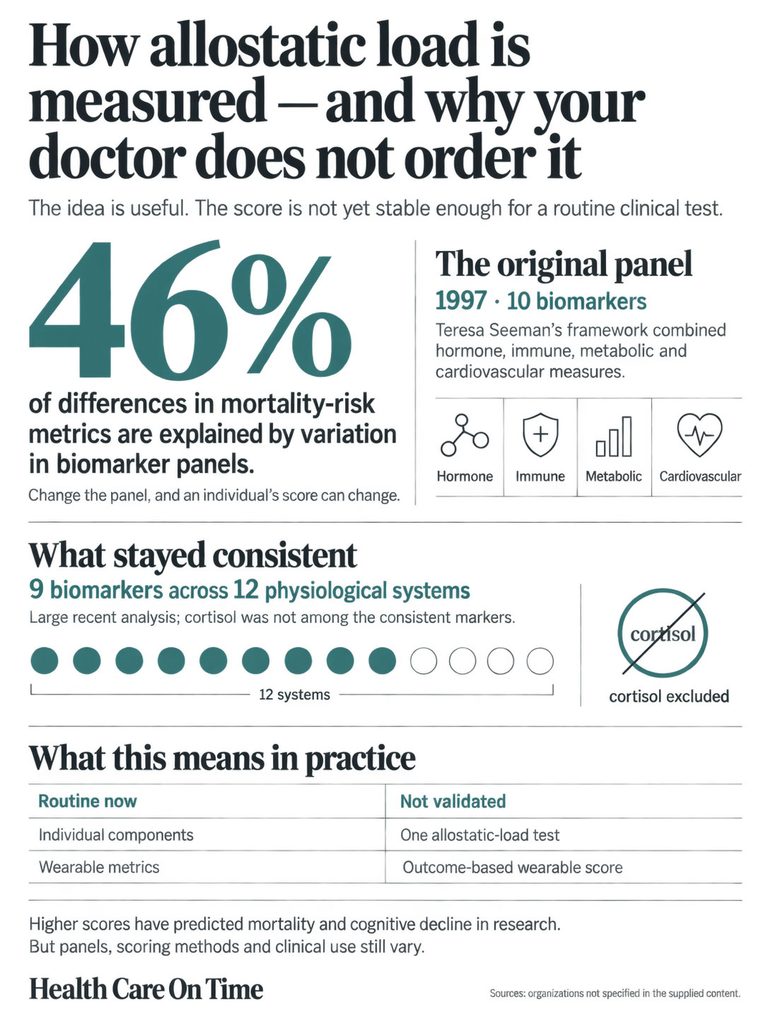
Teresa Seeman and colleagues built the first widely used allostatic load index in 1997 using the MacArthur Studies of Successful Aging. They took 10 measurements across hormone, immune, metabolic, and cardiovascular systems and counted how many fell into the highest-risk quarter of the sample.
The follow-up work in PNAS in 2001 tracked 1,189 men and women aged 70 to 79. Higher baseline scores predicted 7-year mortality and declines in both thinking ability and physical function, independent of demographics and starting health.
It worked. It also set a precedent the field has never fully escaped, since roughly 73% of later studies reused that same quartile-counting approach.
The Panels That Came After
Researchers kept building new versions. Some added fasting glucose and HDL. Some swapped sample-based cut points for clinical ones. Some replaced counting with statistical scoring.
| Method | Biomarkers | Systems Covered | Scoring Approach | Main Limitation |
| Seeman (1997), MacArthur | 10 | Hormone, immune, metabolic, cardiovascular | Count of markers in highest-risk quartile | Quartiles depend on the sample, so scores do not transfer between studies |
| Crimmins (2003) | 12 | Adds fasting glucose and HDL cholesterol | Mix of NHANES-derived and clinical cut points | Requires fasting samples, limiting real-world use |
| Index of Cardiometabolic Health | 8 | Cardiometabolic emphasis | Statistical scoring, mean 50, standard deviation 12.5 | Higher score means lower load, which inverts intuition |
| Moore NHANES score (2021) | 9 | Albumin, BMI, CRP, creatinine, diastolic and systolic BP, HbA1c, total cholesterol, triglycerides | Sum of abnormal components, range 0 to 9 | Contains no direct stress-hormone marker |
| IPD consensus set (2023) | 9 | Nine of twelve physiological systems | Data-driven selection across 13 cohorts | Includes DHEA-S and heart rate variability, rarely available clinically |
That last row deserves attention. A large analysis pooling 67,126 adults aged 40 to 111 across 13 cohort studies tested 40 biomarkers across 12 systems and identified nine that performed consistently: DHEA-S, low-frequency heart rate variability, C-reactive protein, resting heart rate, peak expiratory flow, HDL cholesterol, waist-to-height ratio, HbA1c, and cystatin C.
Notice what is on that list and what is not. Cortisol did not make the cut, despite being the hormone every wellness brand sells you a test for.
The Problem Nobody Talks About: The Score Depends on Who Built It
This is where honest reporting has to override a clean narrative. A specification-curve analysis published in May 2026 took two independent NHANES cohorts, NHANES III with 17,285 participants and NHANES 2007-2010 with 12,729, linked them to the National Death Index through 2019, and built 450 separate analytical specifications by varying biomarker panel, scoring method, covariates, and outcome.
The good news held up. Every single cardiovascular mortality specification and 93.3% of all-cause specifications produced significant hazard ratios above 1.0, with a median of 1.22 for all-cause and 1.36 for cardiovascular death.
The uncomfortable news: biomarker panel composition alone explained 46% of the variance between specifications, compared with just 4% for covariate adjustment. The signal is real. The specific number attached to any one person is not stable.
Can You Buy an Allostatic Load Test?
Not a validated one. No FDA-cleared allostatic load test exists, no billing code covers it, and no US clinical guideline recommends calculating one.
What you can order are the components, and most of them are inexpensive, routine, and already familiar. Blood pressure, waist measurement, hs-CRP, HbA1c, fasting glucose, a lipid profile, serum albumin, and creatinine cover the majority of every published panel.
Across the lab partners we work with, none of those tests requires a specialist referral. Readers who want a picture of their own cumulative strain are usually one standard panel away from having the raw numbers, even if nobody hands them a composite score at the end.
Do Wearables Measure It?
Rings and watches track resting heart rate, heart rate variability, sleep staging, and skin temperature. Two of those, resting heart rate and heart rate variability, do appear in validated panels.
That makes wearables a reasonable trend-watching tool and a poor measurement tool. A “readiness score” is not an allostatic load index, and no consumer device has been validated against death or disease outcomes.
What the Evidence Actually Shows
Concepts are cheap. Numbers are not. Here is what three decades of US population research has produced.
| Finding | Number | Population Studied | Source |
| High allostatic load prevalence, US adults | Rose from 33.5% to 48.6% (a 45%+ increase) | 50,671 NHANES participants, 1988-2018 | Moore et al., Preventive Medicine, 2021 |
| All-cause mortality risk, high vs low load | HR 1.22 (95% CI 1.14-1.30) | Meta-analysis of 17 studies, 2001-2020 | Parker et al., Am J Preventive Medicine, 2022 |
| Cardiovascular mortality risk | HR 1.31 (95% CI 1.10-1.57) | Same meta-analysis, 6 pooled studies | Parker et al., 2022 |
| Cancer death risk, high load | SHR 1.14 (95% CI 1.04-1.26) | NHANES 1988-2010 linked to National Death Index through 2019 | Moore et al., SSM Population Health, 2022 |
| Asthma odds per 1-point index rise | OR 1.13 (95% CI 1.08-1.18) | 15,533 adults, NHANES 2005-2010 | Zhang et al., Medicine, 2025 |
| Adults rating their stress 8-10 out of 10 | 22% of women vs 18% of men; 27% of ages 35-44 vs 8% of ages 65+ | 3,199 US adults, surveyed August 2025 | APA Stress in America 2025 |
Death Rates and Heart Disease
The 2022 meta-analysis in the American Journal of Preventive Medicine remains the anchor. Across 17 eligible studies, every single one showed higher all-cause mortality with high allostatic load, with individual hazard ratios ranging from 1.08 to 2.75.
Pooled, that came to a 22% increase in all-cause mortality risk and a 31% increase for cardiovascular mortality.
Those are not catastrophic numbers. They are the size of a meaningful, modifiable population risk factor, which is exactly how they should be read.
Metabolic and Organ Effects
The associations extend well past the heart. An analysis of NHANES 2017-2020 data found allostatic load scores associated with fatty liver and liver fibrosis in US adults, which fits the metabolic pathway the model predicts.
Airway disease shows a similar pattern. Among 15,533 NHANES participants with a mean age of 45.8, each one-point rise in the allostatic load index was linked to 13% higher odds of asthma after adjusting for age, sex, race and ethnicity, socioeconomic indicators, and smoking.
Cancer outcomes carry a smaller but detectable signal, with a 14% higher risk of cancer death in the fully adjusted NHANES analysis. Across the panels we process, liver enzymes and inflammatory markers are the two categories where readers most often ask what a mildly abnormal result actually means, and this literature is part of the answer.
Brain, Memory, and Dementia
McEwen’s later work focused on the brain as both the organ that decides what counts as stressful and the organ that gets remodeled by the answer.
Population data has caught up. A 2026 analysis using the US Health and Retirement Study examined allostatic load and new dementia diagnoses, along with racial and ethnic differences in that association, and called for longer follow-up plus regular biomarker monitoring as a possible delay strategy.
The authors were careful, and so should readers be. Association is not proof that lowering a score prevents dementia.
Where the Evidence Is Genuinely Weak
Three honest limitations belong on any page claiming authority here.
First, definitional chaos. After more than 30 years, the field still lacks an agreed biomarker panel, which is why the University of Maryland School of Public Health runs an entire Allostatic Load and Health Working Group devoted partly to fixing that inconsistency.
Second, heterogeneity. Most pooled estimates in the mortality meta-analysis showed the individual studies disagreeing with each other a great deal, which widens the uncertainty around any headline figure.
Third, almost all human evidence is observational. Nobody has run a large randomized trial that lowers allostatic load and measures whether deaths fall as a result.
Who Carries the Heaviest Load in America
Averages hide the interesting part. Load is not distributed evenly across the country.
It Climbs With Age
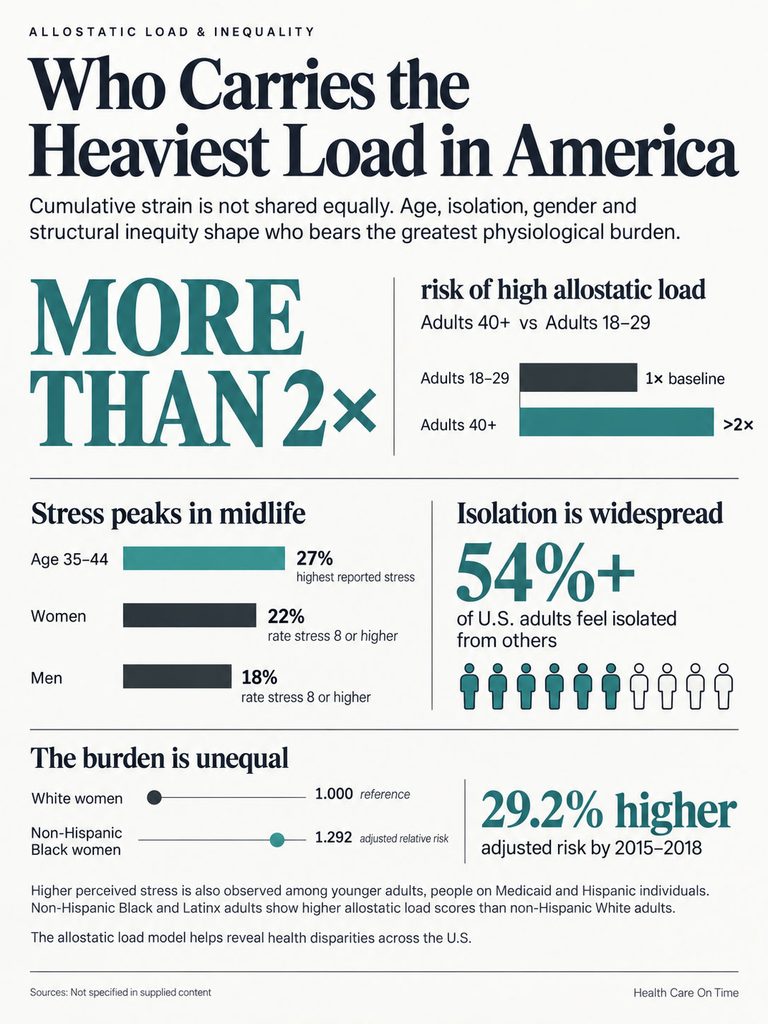
In the 30-year NHANES analysis, adults aged 40 and older carried more than double the risk of high allostatic load compared with adults aged 18 to 29.
That is expected and not, by itself, alarming. Some accumulation is simply what living does.
What matters is the slope. Two people can reach 50 with very different totals.
Women, Work, and the Second Shift
The APA’s Stress in America 2025 report, conducted by The Harris Poll among 3,199 US adults in August 2025, found overall stress holding steady at an average of five out of ten while the distribution shifted underneath.
Women were more likely than men to rate their stress an eight or higher, 22% versus 18%. Adults aged 35 to 44 topped every group at 27%, against just 8% of adults 65 and older.
That midlife peak lines up with caregiving in both directions, peak career demand, and the years when blood pressure and metabolic markers commonly begin drifting. It is also the decade when women most often ask us why a blood pressure reading that used to be unremarkable suddenly is not.
Income, Neighborhood, and Loneliness
The All of Us Research Program analysis of 7,415 US adults aged 18 to 65 went further than most by accounting for discrimination, loneliness, food insecurity, neighborhood disorder, and neighborhood social cohesion.
Participants who were younger, receiving Medicaid, or Hispanic showed higher rates of high perceived stress. The authors also noted that younger adults living in poverty can carry biological risk resembling wealthier adults two decades older.
The APA data adds the social layer. More than half of US adults, 54%, reported feeling isolated from others. Loneliness is not a soft variable in this model. It is an input.
The Weathering Pattern
The most striking finding in the NHANES work concerns cumulative disadvantage. Age-adjusted mean scores among non-Hispanic Black and Latinx adults exceeded scores among non-Hispanic White adults up to a decade older, in both men and women.
By 2015-2018, non-Hispanic Black women carried an adjusted relative risk of 1.292 and Latina women 1.266 compared with non-Hispanic White women. Similar patterns appeared among men.
This is a population-level finding about environments, not a verdict about any individual. It also explains why the allostatic load model has become a favored framework for studying health disparities in the United States.
Signs Your Own Load May Be Climbing
Why There Is No Official Symptom List
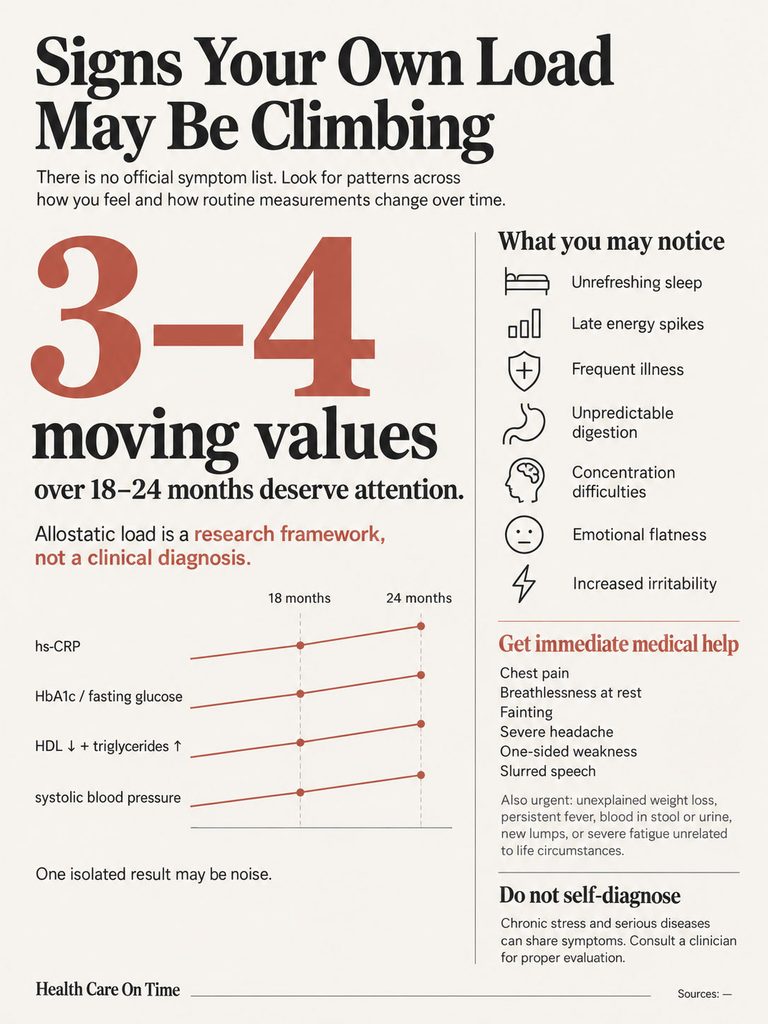
Allostatic load is a research framework, not a clinical diagnosis. There is no symptom checklist because no professional body has defined one.
Any website handing you a tidy list of symptoms of high allostatic load invented it. Our medical reviewers flag this as the single most common piece of misinformation on this topic.
What does exist is a set of experiences people commonly report alongside sustained physiological strain, plus a set of laboratory patterns that show up before disease does.
What People Commonly Notice
Sleep that stops restoring you, even at normal length. Energy that arrives late in the evening and vanishes in the morning.
Getting sick more often than you used to. Digestion that has become unpredictable. Difficulty concentrating on work you handled easily two years ago.
Emotional flatness rather than anxiety, particularly in longstanding situations. Increased irritability with people you care about.
None of these prove anything on their own. Every one has other explanations, some of them serious, which is exactly why self-diagnosis fails here.
What Routine Bloodwork Might Show
Patients commonly ask us what to actually look at. The honest answer is that the pattern matters more than any single value.
Elevated hs-CRP suggests low-grade inflammatory activity. Rising HbA1c or fasting glucose suggests glucose regulation drifting. Falling HDL with rising triglycerides suggests metabolic strain. Creeping systolic blood pressure and expanding waist measurement complete the picture.
Three or four of those moving together over 18 to 24 months is the signature. One value sitting at the edge of a reference range is usually noise.
Red Flags That Need a Doctor, Not a Wellness Plan
Chest pain or pressure, breathlessness at rest, fainting, sudden severe headache, one-sided weakness, or slurred speech require emergency care immediately. None of that is allostatic load territory.
Unexplained weight loss, persistent fever, blood in stool or urine, a new lump, or new severe fatigue that does not track with your life circumstances all need evaluation now, not a stress-reduction plan.
Thoughts of harming yourself require immediate support. In the US, call or text 988 to reach the Suicide and Crisis Lifeline.
Allostatic Load Is Not a Diagnosis You Can Give Yourself
Chronic stress and serious disease produce overlapping symptoms. Thyroid disease, anemia, sleep apnea, depression, diabetes, and several cancers all present with fatigue and cognitive fog.
Deciding on your own that stress explains everything is how people lose two years before a diagnosis. Order the panel, then talk to a clinician about what it shows.
How to Reduce Allostatic Load
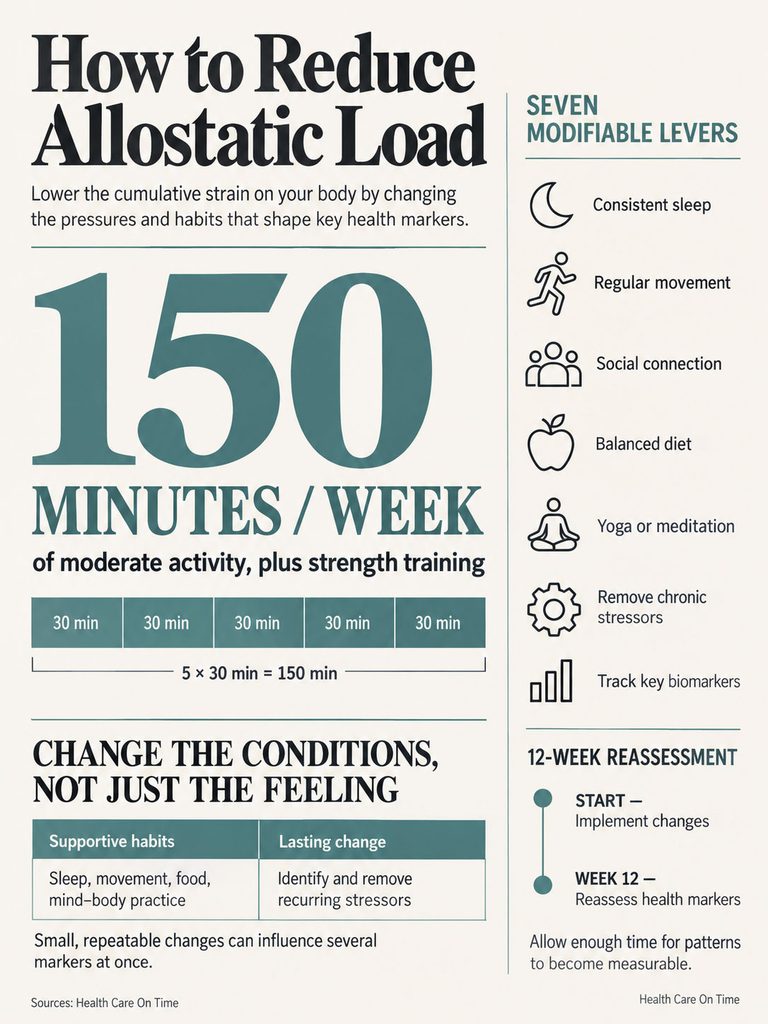
The components of the allostatic load model are modifiable. That is the entire practical value of the framework.
| If This Sounds Like You | Likely Load Driver | Do This First | When to Involve a Clinician |
| Sleeping under 6 hours most nights | Disrupted cortisol rhythm, metabolic drift | Fix wake time before bedtime; hold it seven days a week for four weeks | Loud snoring, gasping, or witnessed pauses; ask about sleep apnea screening |
| Desk job, under 4,000 steps daily | Metabolic and cardiovascular markers | Add two 20-minute brisk walks daily, plus two strength sessions weekly | Chest discomfort or unusual breathlessness on exertion |
| Long-term caregiving or night shifts | Prolonged response with delayed shutdown | Schedule two protected recovery blocks weekly and treat them as fixed | Persistent low mood, or markers worsening despite changes |
| Constant financial pressure | Chronic Type 2 overload with no escape route | Address the concrete stressor directly; symptom management alone will not hold | Blood pressure repeatedly above 130/80 on home readings |
| Living alone, few close contacts | Loneliness as a physiological input | One recurring standing commitment with other people, weekly | Isolation paired with hopelessness or loss of interest |
| Two or more abnormal markers on a recent panel | Lab-stage changes already underway | Repeat the panel in 12 weeks after making one structural change | Any single marker in a clearly abnormal range |
| Symptoms plus abnormal markers, no improvement in 3 months | Possible undiagnosed condition | Stop self-managing | Book a full evaluation; do not extend the experiment |
Sleep First, Because It Moves the Most Markers
Sleep is the intervention with the widest reach across the panel. Short sleep affects glucose handling, blood pressure, inflammatory markers, and appetite regulation at the same time.
The practical lever is consistency rather than duration. A fixed wake time anchors your body clock more reliably than a fixed bedtime, because you control when you get up and cannot control when you fall asleep.
Give any change four weeks before judging it. Two nights proves nothing.
Movement, and the Dose That Shows Up in Bloodwork
The CDC’s adult target of 150 minutes of moderate activity weekly plus two strength sessions is not arbitrary. It is roughly the dose associated with measurable metabolic and cardiovascular change.
A longitudinal analysis of 1,976 women in the Study of Women’s Health Across the Nation, each followed across at least seven measurement waves, examined how lifestyle factors relate to allostatic load change over time rather than at a single snapshot.
Walking counts. The most common mistake we see is treating exercise as all-or-nothing and therefore doing nothing.
Connection Is a Physiological Intervention
Given that more than half of US adults report feeling isolated, this belongs alongside diet and exercise rather than below them.
Social contact is not a mood accessory in this model. It changes the input side of the equation by reducing perceived threat, which is where the whole cascade starts.
Recurring, scheduled contact beats spontaneous intention. A weekly standing commitment outperforms a vague plan to see people more.
What You Eat, and Three of the Nine Markers
Diet directly touches HbA1c, HDL cholesterol, triglycerides, and waist-to-height ratio. That is four of the nine biomarkers in the consensus panel.
Nothing exotic is required. Fiber, protein at each meal, and less refined carbohydrate and alcohol move those four markers in every well-conducted trial.
Alcohol deserves specific mention because it disrupts sleep architecture while raising triglycerides and blood pressure, hitting several components at once.
Mind-Body Practice, Graded Honestly
Reviews of physical activity and yoga as add-on approaches in depression and anxiety report benefits for symptoms and for allostatic load index values.
The same authors state plainly that larger, adequately powered randomized trials are still needed. That caveat belongs in any honest summary.
Slow breathing, meditation, and yoga are low-risk, cheap, and reasonable. They are supportive evidence, not proven treatment.
The Uncomfortable One: Removing the Stressor
Every technique above manages the response. Only one thing changes the input.
Type 2 overload, the version most Americans experience, does not resolve through adaptation. It resolves through changed circumstances, which sometimes means a different job, a renegotiated caregiving arrangement, or a hard conversation.
Breathing exercises will not offset a situation that is genuinely unsustainable. Naming that honestly is more useful than another app.
How Long Before Anything Changes?
Inflammatory markers can shift within weeks. HbA1c reflects roughly three months of blood sugar exposure, so retesting sooner tells you nothing.
Twelve weeks is the sensible interval for a repeat panel. Twelve months is a fairer window for judging whether a lifestyle change is holding.
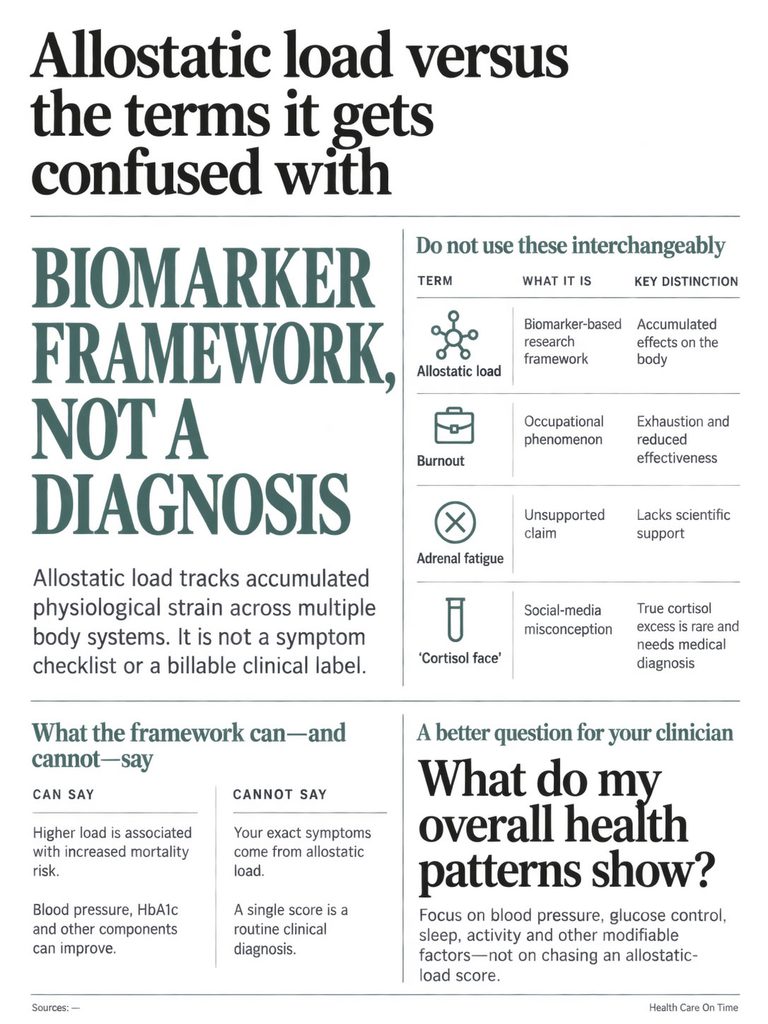
Allostatic Load Versus the Terms It Gets Confused With
Not the Same as Burnout
Burnout is an occupational phenomenon defined by exhaustion, mental distance from work, and reduced effectiveness. The ICD-11 describes it as an occupational syndrome, not a medical condition.
Allostatic load is physiological and measured in biomarkers. You can have high allostatic load with no burnout, and burnout with an unremarkable metabolic panel.
Not “Adrenal Fatigue”
Adrenal fatigue is not recognized by the Endocrine Society or any major US medical body. The proposed mechanism, exhausted adrenal glands that stop producing cortisol, has not held up in testing.
Allostatic load is a peer-reviewed framework with three decades of population data behind it. The two get conflated constantly in wellness marketing, and they should not be.
Not “Cortisol Face”
Social media popularized the idea that facial puffiness reveals chronic stress. Genuine cortisol excess, called Cushing syndrome, is rare and comes with a specific cluster of findings that a physician diagnoses through defined testing.
Single random cortisol measurements are notoriously hard to interpret because the hormone swings by the hour. Cortisol did not make the consensus allostatic load panel for exactly this reason.
Not a Billable Diagnosis
Your physician is unlikely to use the term, and that is not a failure on their part. There is no diagnostic code, no validated cut point, and no guideline recommending clinical use.
The useful move is not asking for a score. It is asking whether your blood pressure, hs-CRP, HbA1c, lipids, and waist measurement are drifting together, and what that pattern suggests.
Frequently Asked Questions
What is allostatic load in simple terms?
It is the accumulated wear and tear your body takes on from repeated or unrelenting stress. Rather than measuring how stressed you feel, it tracks physical changes across several systems at once, including blood pressure, blood sugar, cholesterol, inflammation, and stress hormones, that build up quietly over years.
Who came up with the allostatic load model?
Neuroscientist Bruce McEwen of Rockefeller University and Eliot Stellar introduced the term in 1993. It built on the concept of allostasis, described by Peter Sterling and Joseph Eyer in 1988. Teresa Seeman later developed the first widely used index using the MacArthur Studies of Successful Aging.
What is the difference between allostasis and allostatic load?
Allostasis is the healthy process of achieving stability through change, meaning your body adjusts its set points to meet demand. Allostatic load is the cost of doing that too often or for too long. Allostasis keeps you alive; allostatic load is the bill that arrives afterward.
What are the four types of allostatic load?
Repeated hits from multiple stressors, lack of adaptation where the same stressor keeps triggering a full response, prolonged response where the system shuts down late, and inadequate response where one system underperforms and others overcompensate. Each produces a different pattern of physiological strain over time.
Can a blood test measure my allostatic load?
No single test exists, and there is no FDA-cleared allostatic load test in the United States. Researchers calculate a score from ordinary measurements you can already get, including blood pressure, waist measurement, hs-CRP, HbA1c, lipid profile, albumin, and creatinine.
What biomarkers are in an allostatic load index?
It depends on the study. A large 2023 analysis across 13 cohorts identified nine consistent performers: DHEA-S, low-frequency heart rate variability, C-reactive protein, resting heart rate, peak expiratory flow, HDL cholesterol, waist-to-height ratio, HbA1c, and cystatin C. Older panels used ten or twelve different markers.
What are the symptoms of high allostatic load?
There is no official symptom list, because allostatic load is a research framework rather than a diagnosis. People often report unrefreshing sleep, frequent illness, digestive changes, and concentration problems. These have many other causes, so laboratory patterns matter more than symptoms for assessing physiological strain.
Does high allostatic load shorten your life?
Pooled data from 17 studies found high allostatic load associated with a 22% higher all-cause mortality risk and a 31% higher cardiovascular mortality risk. These are meaningful population-level associations from observational research, not proof that lowering a score extends any particular person’s life.
Is allostatic load the same as burnout?
No. Burnout is an occupational syndrome defined by exhaustion, mental distance from work, and reduced effectiveness. Allostatic load is physiological and measured through biomarkers. You can have one without the other, though chronic work stress can certainly contribute to both at the same time.
Can allostatic load go back down?
The individual components are modifiable, which is the practical point of the model. Blood pressure, HbA1c, lipids, waist measurement, and inflammatory markers all respond to sleep, movement, diet, and reduced stress exposure. Allow twelve weeks before retesting and twelve months before judging a lasting change.
Do smartwatches and rings measure allostatic load?
Not directly. Resting heart rate and heart rate variability do appear in validated panels, so wearables can show useful trends. No consumer device has been validated against health outcomes as an allostatic load measure, and readiness scores are not equivalent to a research index.
Should I ask my doctor about allostatic load?
Asking for a score will not get far, since no clinical guideline supports one. A more productive question is whether your blood pressure, hs-CRP, HbA1c, lipids, and waist measurement have been drifting in the same direction over recent years, and what that combined pattern suggests.
Medical Disclaimer: This article is for general education and does not replace medical advice, diagnosis, or treatment. Allostatic load is a research framework, not a clinical diagnosis, and no validated allostatic load test is available in the United States. Always talk with a qualified healthcare provider about your own test results, symptoms, and treatment decisions. If you are having a medical emergency, call 911. If you are in crisis, call or text 988 to reach the Suicide and Crisis Lifeline.
References
- Stress, Adaptation, and Disease: Allostasis and Allostatic Load, McEwen, Annals of the New York Academy of Sciences
- Allostatic Load as a Marker of Cumulative Biological Risk: MacArthur Studies of Successful Aging, Seeman et al., PNAS
- Four Types of Allostatic Load, MacArthur SES and Health Network, UCSF
- Temporal Changes in Allostatic Load Patterns Among the US Adult Population, 1988-2018, Preventive Medicine
- Allostatic Load and Mortality: A Systematic Review and Meta-Analysis, American Journal of Preventive Medicine
- Towards a Consensus Definition of Allostatic Load: Multi-Cohort IPD Meta-Analysis, Psychoneuroendocrinology
- Biomarker Panel Selection Explains Heterogeneity in Allostatic Load-Mortality Risk, medRxiv, May 2026
- Perceived Stress and Allostatic Load: Results from the All of Us Research Program, PLOS One
- Racial Disparities in Allostatic Load and Cancer Mortality, NHANES 1988-2019, SSM Population Health
- Association Between Allostatic Load and Asthma in US Adults, NHANES 2005-2010
- Allostatic Load, Fatty Liver and Liver Fibrosis, NHANES 2017-2020
- Allostatic Load and Incident Dementia in the US Health and Retirement Study, Psychoneuroendocrinology, 2026
- Cellular Allostatic Load, Energy Expenditure, and Accelerated Biological Aging
- Allostatic Load Score and Lifestyle Factors in the SWAN Cohort, Public Health in Practice, 2025
- Reducing Allostatic Load in Depression and Anxiety Disorders: Physical Activity and Yoga as Add-On Therapies
- Stress in America 2025: A Crisis of Connection, American Psychological Association
- Allostatic Load and Health Working Group, University of Maryland School of Public Health