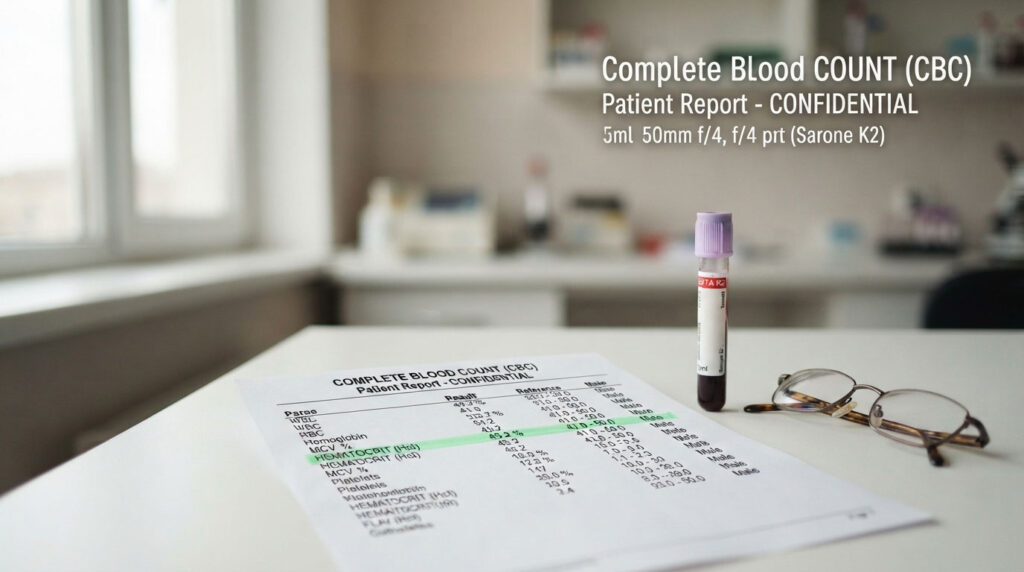
Two labs can run the same tube of blood and print two different verdicts. One calls a 47 percent hematocrit perfectly normal. The other stamps it with an H. Neither analyzer malfunctioned. The reference range printed beside your result was built by that specific lab, on that specific machine, for that specific population. That single fact explains most of the confusion people bring to a hematocrit result.
Table of Contents
Quick Answer
Hematocrit is the percentage of your blood volume made up of red blood cells. Most adult men fall between roughly 40 and 54 percent. Most adult women fall between roughly 36 and 48 percent. A result below the range usually points toward anemia. A result above it usually points toward dehydration, low oxygen exposure, or increased red cell production. Ranges shift with age, sex, pregnancy, altitude, and laboratory method.
At a Glance
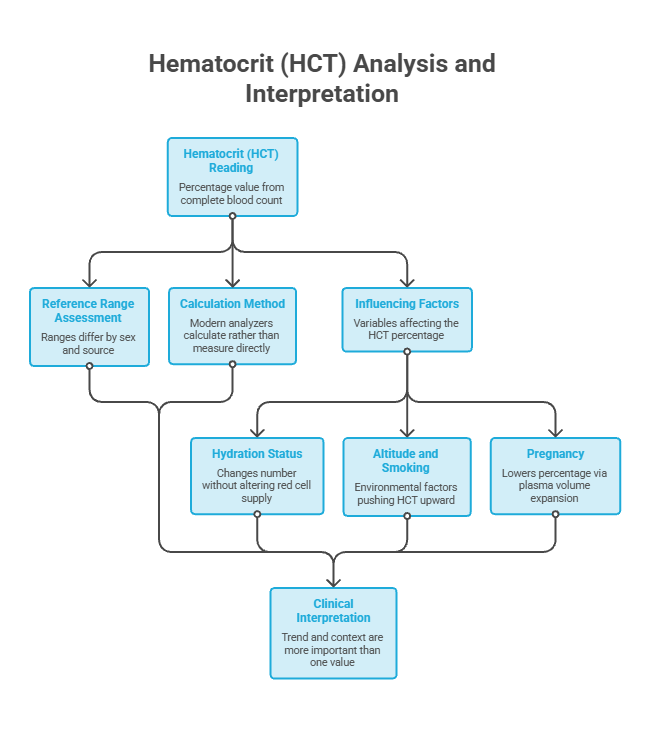
• Hematocrit (HCT) appears as a percentage on your complete blood count.
• Adult reference ranges differ by sex, and published ranges vary between credible sources by several percentage points.
• Most modern analyzers calculate hematocrit rather than measuring it directly.
• Hydration status moves the number without changing your actual red cell supply.
• Altitude and smoking both push hematocrit upward in otherwise healthy people.
• Pregnancy lowers the percentage by design, through plasma volume expansion.
• One value in isolation settles very little. Trend and context carry the weight.
What the Hematocrit Blood Test Actually Measures
Hematocrit answers one question: of everything moving through your bloodstream, what share is red blood cells? The rest is plasma, white cells, and platelets.
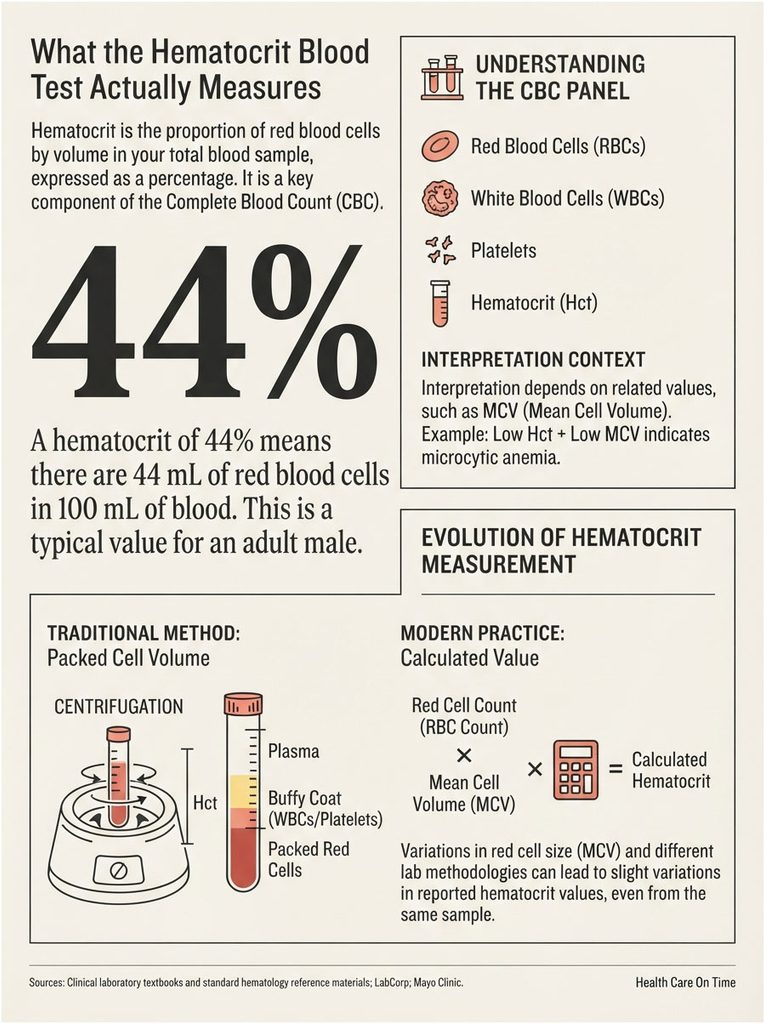
If your hematocrit reads 44 percent, then 44 milliliters out of every 100 milliliters of blood is packed red cells. The number is a ratio, not a count, and that distinction drives almost everything that follows.
Where It Sits Inside the Complete Blood Count
Hematocrit never travels alone. It arrives as one line on a CBC, sitting beside hemoglobin, red blood cell count, MCV, MCH, MCHC, RDW, white cells, and platelets.
Clinicians read those lines together. A hematocrit of 34 percent alongside a small MCV tells a completely different story than the same 34 percent alongside a large MCV.
Spun Hematocrit Versus Calculated Hematocrit
The original method was mechanical. Spin a tube of blood at high speed, the red cells pack into the bottom, and you measure the column directly.
Modern practice mostly skipped that step. Automated cell counters calculate hematocrit by multiplying the red cell number by the mean cell volume rather than measuring the packed column, according to NIH Clinical Methods.
Why the Method Changes the Number
A calculated value inherits every quirk of the two inputs behind it. Variations in red cell size can alter the result, and a markedly elevated white blood cell count can introduce inaccuracy, per Medscape reference range data.
That is one reason two labs report different numbers on the same patient in the same week. Our medical reviewers field this question more often than almost any other lab question, and the answer is usually methodology rather than physiology.
How to Read Hematocrit on Your Own Lab Report
Most people scan for the number and skip the column that actually matters.
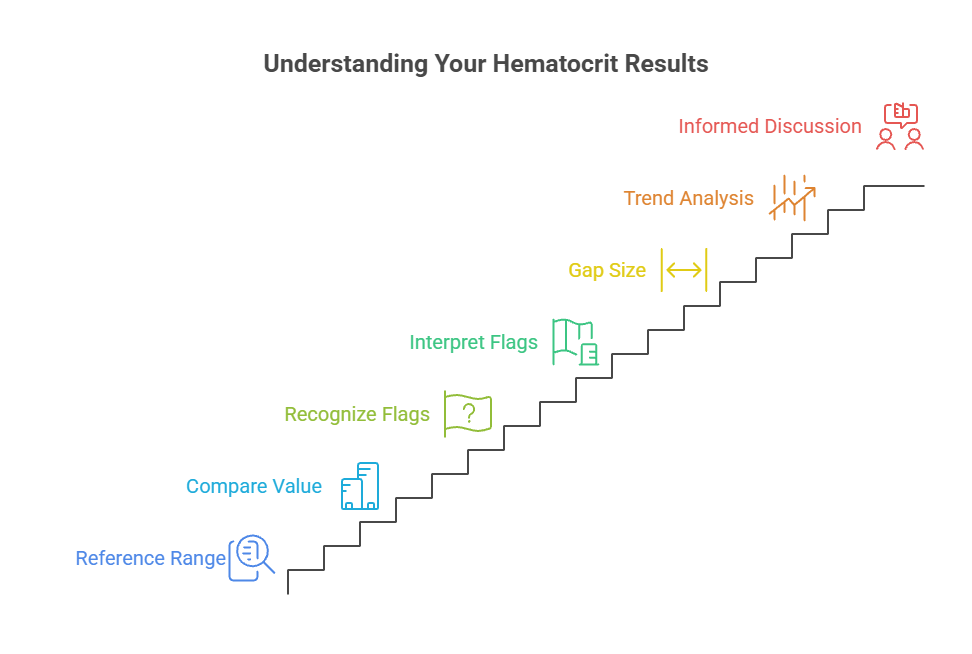
The Reference Range Column Comes First
Every CBC prints a reference interval beside each result. That interval belongs to the lab that ran your sample.
Comparing your 46 percent to a range you found online is a fast route to unnecessary worry. Compare it to the range on your own page.
What the H and L Flags Do and Do Not Mean
A letter H or L beside the value simply marks a result above or below that lab’s interval, per Cleveland Clinic.
The flag is a sorting tool, not a diagnosis. Reference intervals are built to capture the middle 95 percent of a healthy population, which means roughly one healthy person in twenty gets flagged on any given test.
A value sitting one point outside the range is a different situation from one sitting ten points outside. Note the size of the gap, not just the letter.
Why Trend Beats Any Single Value
A stable 38 percent across five annual panels reads very differently from a slide from 45 to 38 percent over six months.
Pull your last two or three CBC reports before your appointment. In reports reviewed across our diagnostic network, the direction of travel prompts more useful conversations than any isolated figure.
Hematocrit Normal Range by Age and Sex
There is no single universal normal. There is a band that most healthy people occupy, and that band shifts across the lifespan.
Adult Men and Adult Women
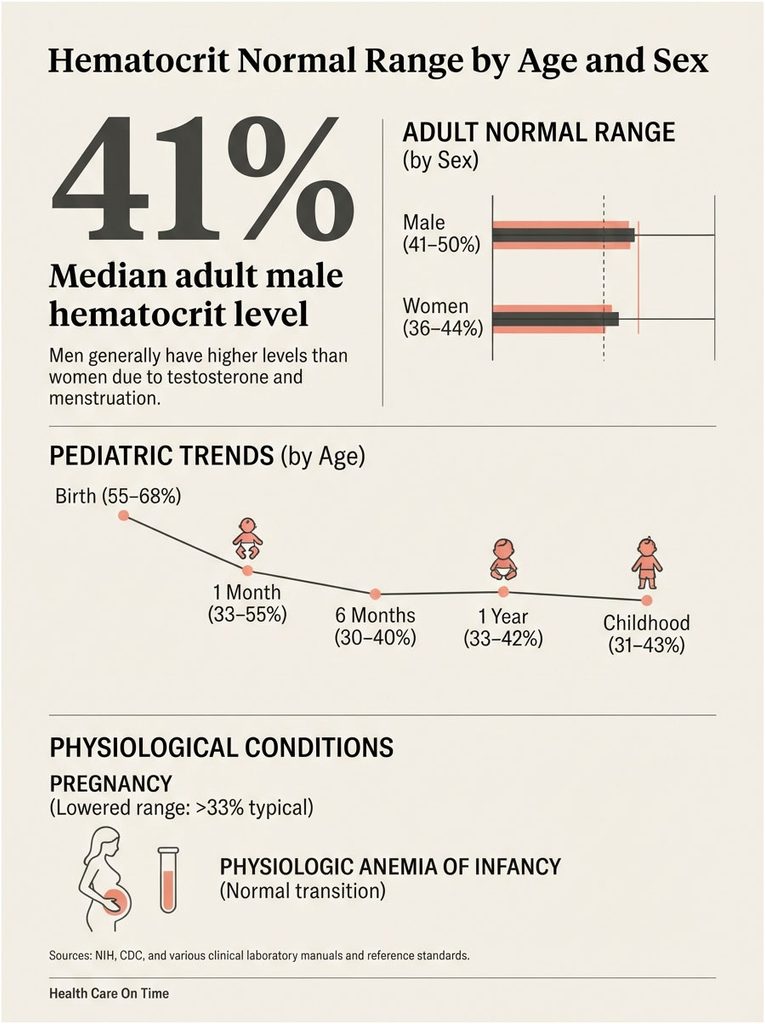
Men run higher than women, largely because testosterone drives red cell production and because menstruation creates ongoing iron loss.
The published ranges disagree with each other, and the disagreement is instructive. NIH Clinical Methods lists 40 to 54 percent for men and 36 to 48 percent for women. The American Red Cross lists 41 to 50 percent for men and 36 to 44 percent for women. Medscape lists 42 to 50 percent for males and 37 to 47 percent for females.
None of those sources is wrong. Each drew on a different population and a different analyzer.
Children, Infants, and Newborns
Newborns carry the highest hematocrit any human will ever have, then drop sharply across the first few months.
Published pediatric tables place hematocrit at 42 to 65 percent from birth to one month, 33 to 55 percent at one to two months, 28 to 41 percent at two to three months, and 31 to 41 percent from six months to one year.
That fall is normal and self-correcting. Clinicians call it physiologic anemia of infancy, and it reflects the handover from fetal hemoglobin to adult hemoglobin.
At the opposite end, newborn polycythemia is defined as a central venous hematocrit above 65 percent, per StatPearls.
Pregnancy and the Fluid Volume Effect
Pregnancy lowers hematocrit deliberately. Plasma volume climbs 40 to 50 percent while red cell mass rises only 15 to 25 percent, so average hematocrit falls from 38 to 45 percent before pregnancy to about 34 percent late in a single pregnancy and near 30 percent in a twin pregnancy, per the Merck Manual.
Because of that dilution, pregnancy gets its own thresholds. The CDC defines anemia in pregnancy as hematocrit under 33 percent in the first and third trimesters and under 32 percent in the second, as summarized in Blood.
Across the patients we serve, a mid-pregnancy dip inside those thresholds is the expected pattern rather than a warning sign.
Why Published Ranges Disagree
Reference ranges depend on the methodology used, and each clinical laboratory is expected to validate its own. Population, altitude, analyzer model, and the era the range was established all feed into the final numbers.
Table 1: Hematocrit Normal Range by Group
| Group | Typical Normal Range | Counted as Low | Counted as High | Reference Source |
| Adult men | 40 to 54% | Below 40% | Above 54% | NIH Clinical Methods |
| Adult women, not pregnant | 36 to 48% | Below 36% | Above 48% | NIH Clinical Methods |
| Pregnancy, 1st and 3rd trimester | Average near 36 to 37% | Below 33% | Above 41% | CDC and ACOG |
| Pregnancy, late single gestation | Average near 34% | Below 33% | Above 41% | Merck Manual |
| Infants, 2 to 3 months | 28 to 41% | Below 28% | Above 41% | Pediatric reference tables |
| Newborns, 0 to 1 month | 42 to 65% | Below 42% | Above 65% | Pediatric tables and StatPearls |
What a Low Hematocrit Means and What Drives It
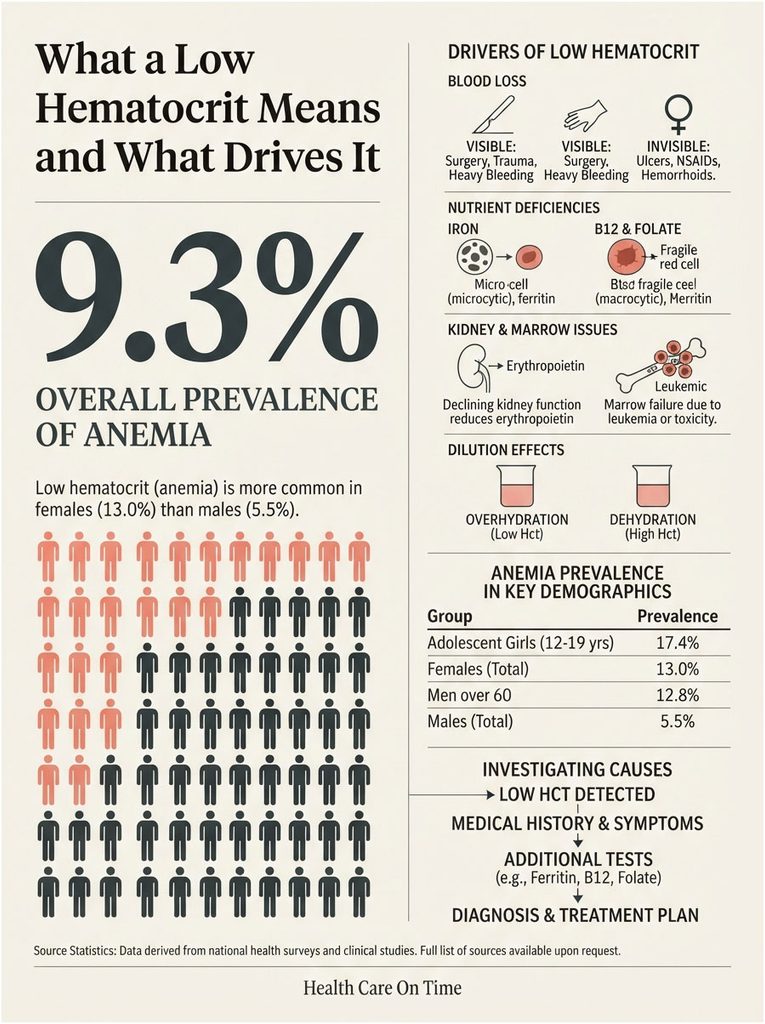
A low hematocrit means red cells occupy a smaller share of your blood than expected. In practice that means anemia, and anemia is a finding rather than a diagnosis. The work is figuring out which of three mechanisms produced it.
Blood Loss You Can See and Blood Loss You Cannot
Visible loss is straightforward: surgery, trauma, a nosebleed that would not stop, heavy menstrual bleeding.
Invisible loss is the one that matters more, because it runs for months without announcing itself. A bleeding ulcer, chronic NSAID use, hemorrhoids, or a colon lesion can each leak small volumes daily.
That slow drip is why a falling hematocrit in an adult man or a postmenopausal woman prompts gastrointestinal evaluation even when nothing hurts.
Nutrient Related Causes
Iron Deficiency
Iron shortage is the single most common driver in the United States. Without enough iron, marrow builds smaller and paler red cells, so MCV usually falls alongside hematocrit.
Ferritin is the test that confirms it. A normal hemoglobin with a low ferritin means the tank is draining even though the gauge has not moved yet.
B12 and Folate
These deficiencies do the opposite to cell size. Red cells grow large and fragile, MCV climbs, and hematocrit still falls because those oversized cells die early.
Causes include restricted diets, absorption problems after bariatric surgery, long-term metformin or acid-suppressing medication, and pernicious anemia.
Kidney Disease, Chronic Inflammation, and Marrow Causes
Kidneys produce erythropoietin, the hormone that instructs marrow to build red cells. When kidney function declines, that instruction weakens and hematocrit drifts down.
Long-running inflammation creates a similar effect by locking iron away from the marrow, which is why rheumatoid arthritis, inflammatory bowel disease, and chronic infection all produce anemia with normal or high ferritin.
Marrow itself can also fail to produce new red cells because of leukemia, other cancers, drug toxicity, radiation therapy, infection, or marrow disorders, per UF Health.
Dilution: IV Fluids, Overhydration, and Pregnancy
Sometimes the red cell supply is fine and the denominator changed. Overhydration lowers hematocrit, just as dehydration falsely raises it, per Grifols.
A hospital patient who received several liters of IV fluid overnight shows a lower morning hematocrit without having lost a single red cell.
Why Hematocrit Lags Behind Acute Bleeding
This one catches people out. In the first hours of heavy bleeding you lose red cells and plasma together, so the ratio between them barely shifts.
Hematocrit measurements are often unreliable immediately following acute hemorrhage. The number falls later, once the body pulls fluid back into circulation to restore volume.
Who Carries the Highest Risk in the US
The CDC’s NCHS Data Brief 519 put overall anemia prevalence at 9.3 percent in people age 2 and older during August 2021 to August 2023, higher in females at 13.0 percent than males at 5.5 percent.
Prevalence reached 17.4 percent in adolescent girls ages 12 to 19 and 12.8 percent in men 60 and older. Our lab partners report that the adolescent figure surprises families more than any other number in the dataset. It reflects menstrual iron loss colliding with a growth spurt.
Table 2: US Data Points on Low Hematocrit and Anemia
| US Statistic | Figure | Source |
| Overall anemia prevalence, age 2 and older | 9.3% | NCHS Data Brief 519, NHANES Aug 2021 to Aug 2023 |
| Anemia prevalence, females vs males | 13.0% vs 5.5% | NCHS Data Brief 519 |
| Anemia prevalence, adults 60 and older | 12.5% | NCHS Data Brief 519 |
| Anemia prevalence, girls ages 12 to 19 | 17.4% | NCHS Data Brief 519 |
| Anemia prevalence, men 60 and older | 12.8% | NCHS Data Brief 519 |
| Iron deficiency in US pregnancy | 25% overall, rising to 39% by third trimester | ASH Education Program, NHANES 1999 to 2006 |
What a High Hematocrit Means and What Drives It
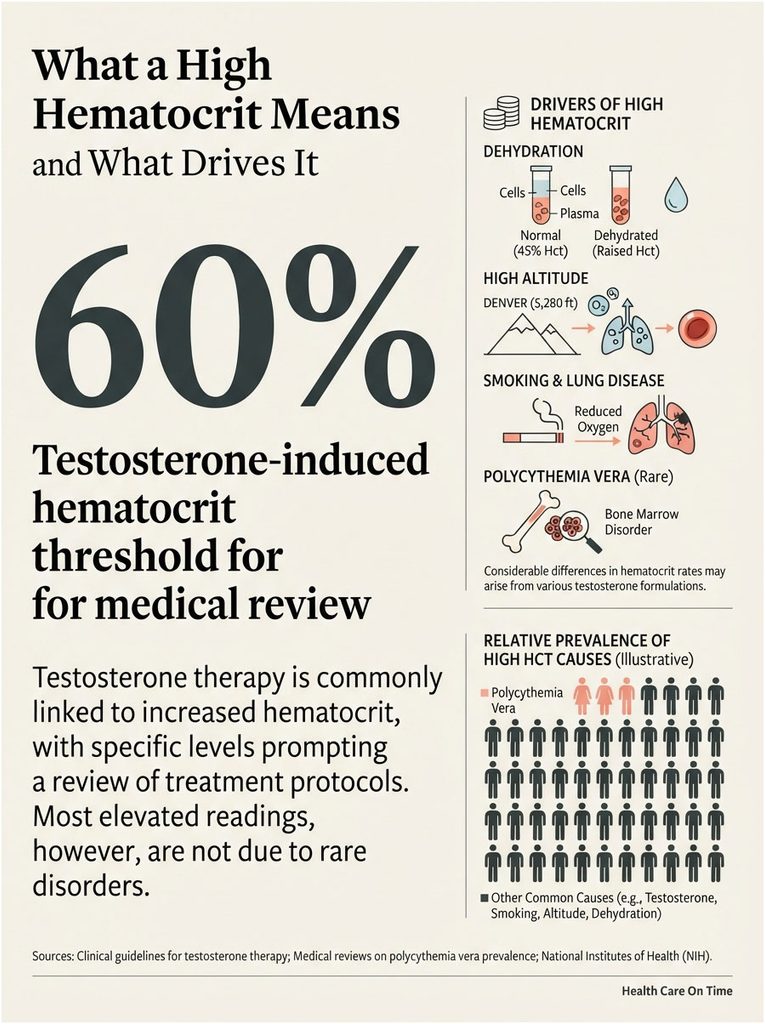
A high hematocrit means red cells take up more of your blood than expected. Thicker blood moves less easily through small vessels, which is why the number draws attention.
The clinical term is erythrocytosis. Polycythemia is used interchangeably in most settings.
Dehydration and Hemoconcentration
This is the most common false alarm on the entire list. Lose plasma water and the red cell share rises even though red cell mass never changed.
Skipped fluids before a fasting draw, a stomach bug, a long flight, heavy sweating, or diuretic use can each do it. Repeat testing after normal hydration resolves a large share of these findings.
Altitude and Why Denver Reads Higher Than Miami
Thinner air delivers less oxygen per breath, and the body compensates by building more red cells. Long-term exposure to high altitude naturally increases hematocrit.
Residents of Denver, Colorado Springs, Salt Lake City, and Albuquerque routinely carry values that would look elevated at sea level. WHO updated its hemoglobin thresholds in 2024 and revised the adjustments applied for altitude and smoking, reported in The Lancet Haematology.
Smoking, Sleep Apnea, and Lung Disease
Carbon monoxide from cigarettes occupies hemoglobin that oxygen should be using. The body reads that as low oxygen and builds more red cells to compensate.
Hemoglobin can run up to 1 g/dL higher in smokers, with the size of the increase tracking daily cigarette volume, per Annals of the New York Academy of Sciences.
Smoking and chronic obstructive pulmonary disease both push levels into a higher range, per Medical News Today. Untreated obstructive sleep apnea produces the same effect through repeated nighttime oxygen dips, which is why a high reading in a heavy snorer often leads to a sleep study rather than a hematology referral.
Testosterone Therapy and the 54 Percent Line
Testosterone stimulates red cell production. That is a known, dose-related effect rather than an unexpected complication, and it has generated the clearest numeric thresholds in this whole subject.
The Endocrine Society clinical practice guideline defines therapy-related erythrocytosis as hematocrit above 54 percent, and advises withholding testosterone until the value returns to range, then resuming at a lower dose, with therapeutic phlebotomy as an additional option.
2018 American Urological Association guidance sets an earlier trigger, recommending investigation above 50 percent and dose reduction or temporary discontinuation at 54 percent or higher, as compared in Blood Advances.
How often does it actually happen? Rates swing sharply by formulation. In the TRAVERSE trial of 5,246 men on testosterone gel, fewer than 1 percent crossed 54 percent even after titration to the lowest dose, while in the T4DM injection trial 22 percent reached 54 percent or higher and 5 percent stopped treatment as a result, per Endocrine Connections.
A 20-year follow-up of 1,073 people on testosterone found erythrocytosis in 11 percent above 50 percent, 3.7 percent above 52 percent, and 0.5 percent above 54 percent, with hematocrit rising most steeply during the first year of therapy, published in the Journal of Clinical Endocrinology and Metabolism.
Patients booking hormone monitoring panels with us ask about this constantly. The pattern is consistent: injectable formulations and higher trough levels account for most of the movement.
Polycythemia Vera and Clonal Causes
A small share of high results reflect a bone marrow disorder rather than an environmental cause. Under WHO 2016 and 2022 criteria, hematocrit above 49 percent in men and above 48 percent in women at sea level is suggestive of polycythemia vera, per StatPearls.
Those thresholds open an investigation rather than close one. Confirmation involves erythropoietin levels, JAK2 mutation testing, and often marrow examination.
Estimated US prevalence of polycythemia vera sits at 45 to 57 cases per 100,000 people. Set against how many Americans get a CBC each year, the overwhelming majority of elevated readings are not this.
Hematocrit vs Hemoglobin vs Red Blood Cell Count
These three arrive together and get treated as interchangeable. They are not.
What Each One Measures
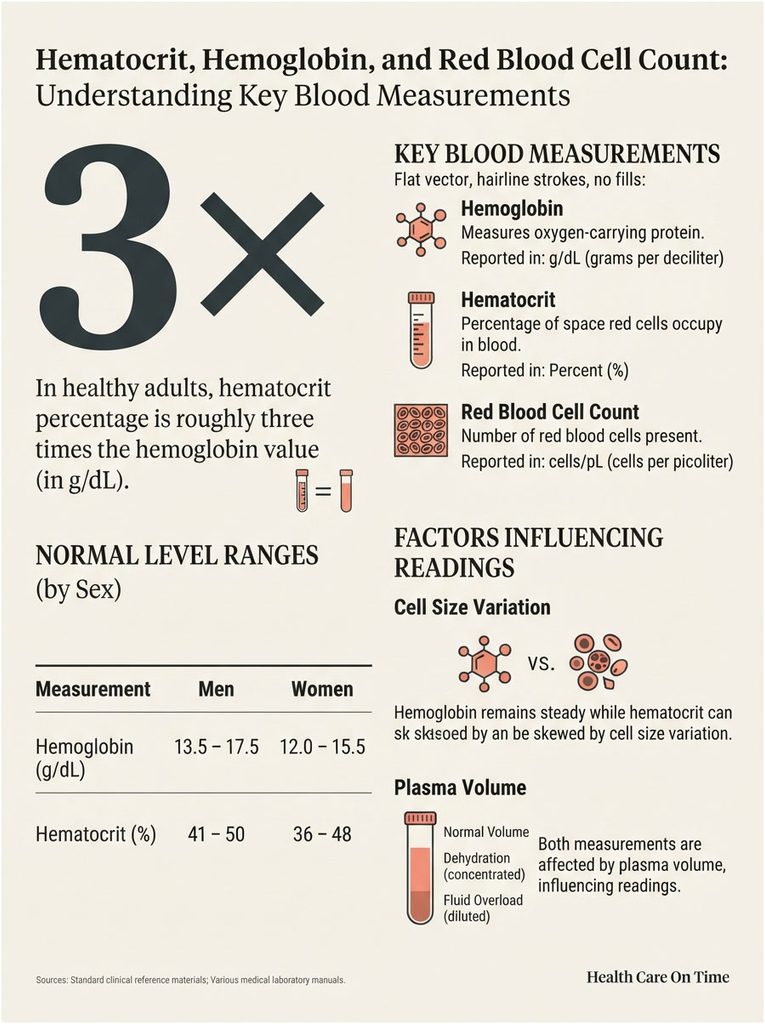
Hemoglobin measures the oxygen-carrying protein itself, reported in grams per deciliter. Hematocrit measures the space red cells occupy, reported as a percentage. Red blood cell count measures how many cells are present.
The Red Cross lists normal hemoglobin at 13.5 to 17.5 g/dL for men and 12.0 to 15.5 g/dL for women, alongside hematocrit of 41 to 50 percent and 36 to 48 percent respectively.
The Rough Three to One Relationship
In healthy adults, hematocrit runs at roughly three times the hemoglobin value. A hemoglobin of 14 g/dL pairs with a hematocrit near 42 percent.
That shortcut holds until red cell size changes. In iron deficiency, thalassemia trait, or after transfusion, the ratio drifts and the shortcut stops working.
When Hemoglobin Looks Normal and Hematocrit Does Not
Because hematocrit is calculated from cell count and cell size, unusually large or small cells skew it while hemoglobin holds steady. Borderline mismatches between the two are common and usually reflect cell size rather than a new problem.
Both values depend on plasma volume, so a dehydrated patient shows falsely high readings and a fluid-overloaded patient shows falsely low ones.
Variables That Move the Number Without Moving Your Health
Several ordinary factors shift hematocrit by a few points. Knowing them prevents avoidable alarm.
Hydration Before the Draw
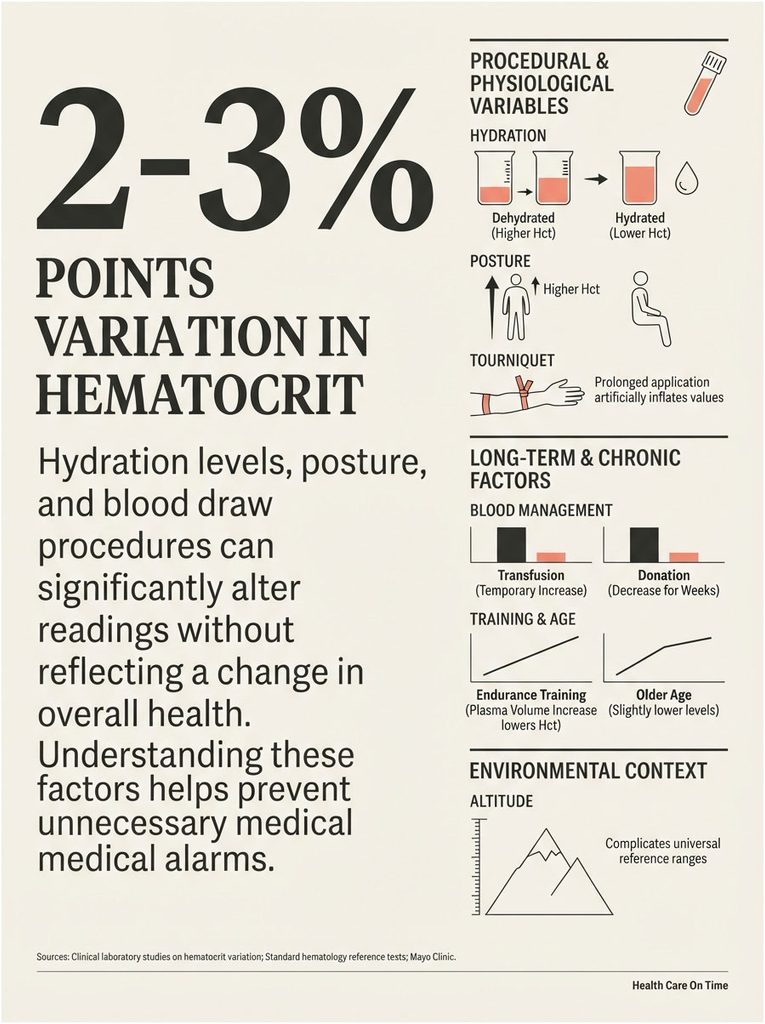
This is the largest factor you control. Someone who arrives thirsty after a long fasting window can read two or three points above their own baseline.
Standing also shifts fluid out of the bloodstream, so an upright draw reads slightly higher than a seated one, and a long tourniquet application nudges the value the same direction.
Recent Transfusion, Donation, or Endurance Training
A recent blood transfusion can affect results. Whole blood donation drops hematocrit for several weeks while marrow rebuilds the loss.
Endurance athletes present a twist worth knowing. Training expands plasma volume, which can lower hematocrit even while total red cell mass climbs.
Altitude of Residence and Older Age
Values may run slightly lower in older adults. Stack that against altitude effects and the idea of one national reference range starts to look crude.
How Clinicians Read the Result in Context
A hematocrit number becomes useful the moment it is placed next to everything else in the picture.
The Repeat Test
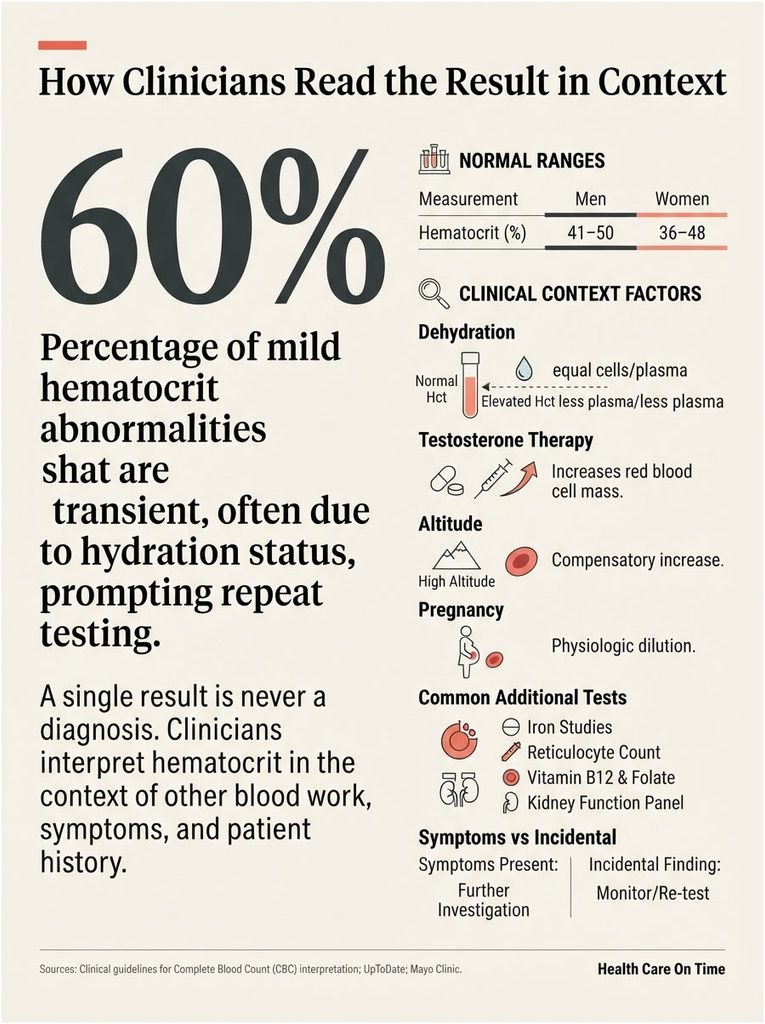
Mild abnormalities are commonly rechecked before anything else happens. Hydration alone explains a large share of them, and a second draw under normal conditions settles many cases.
What Gets Ordered Alongside It
For a low result, the usual next layer is ferritin, iron studies, B12, folate, reticulocyte count, and kidney function. Stool testing enters when silent bleeding is on the table.
For a high result, the next layer is erythropoietin level, oxygen saturation, sleep study referral, and JAK2 testing when the environmental causes have been ruled out.
Symptoms Versus Incidental Findings
A high hematocrit sometimes means the body is producing more red cells because tissues need more oxygen, and living at high altitude can raise it without any cause for concern, per Cleveland Clinic.
A borderline number with no symptoms is handled differently from the same number in someone reporting headaches, unusual fatigue, or shortness of breath. Our medical team notes that symptom pairing is what changes the pace of follow-up more than the size of the number itself.
Table 3: Common Scenarios and Typical Next Steps
| Scenario | What It Commonly Reflects | What Clinicians Typically Do Next |
| Hematocrit 33% in a woman with heavy periods | Iron deficiency from ongoing menstrual loss | Ferritin and iron studies, dietary and supplement review |
| Hematocrit 36% in a man over 50, no symptoms | Below male range, source of loss unclear | Repeat CBC, stool occult blood testing, iron studies |
| Hematocrit 52% after a stomach illness | Hemoconcentration from fluid loss | Rehydrate, repeat CBC in one to two weeks |
| Hematocrit 55% on testosterone therapy | Therapy-related erythrocytosis above the 54% line | Dose review, formulation change, phlebotomy discussion |
| Hematocrit 51% in a smoker who snores heavily | Chronic low oxygen from smoking or sleep apnea | Oxygen saturation check, sleep study referral, cessation support |
| Hematocrit 42% with ongoing fatigue | Value inside range, symptoms unexplained | Look past the CBC: thyroid, ferritin, B12, sleep quality |
Table 3 describes patterns documented in clinical literature. It is not a substitute for evaluation of your own results by a clinician who can see your full history.
Frequently Asked Questions
What is a normal hematocrit level for a woman?
Most published ranges for adult women who are not pregnant fall between 36 and 48 percent, though some labs use a narrower band such as 36 to 44 percent. Compare your result to the range printed on your own report, since each lab validates its own numbers.
What is a normal hematocrit level for a man?
Adult male ranges generally run from 40 to 54 percent, with some sources listing 41 to 50 percent or 42 to 50 percent. The variation reflects different reference populations and analyzers rather than any disagreement about biology.
Is a hematocrit of 50 percent too high?
For an adult man, 50 percent sits inside most published ranges. For an adult woman it is above nearly all of them. WHO criteria flag values above 49 percent in men and 48 percent in women at sea level as worth further evaluation, not as a diagnosis on their own.
What hematocrit level is considered dangerous?
There is no single cutoff. Guidelines for testosterone therapy use 54 percent as an action threshold, and newborn polycythemia is defined above 65 percent. On the low side, severity depends on how fast the drop happened and whether symptoms accompany it.
Can dehydration cause a high hematocrit?
Yes, and it is the most frequent explanation for a mildly elevated result. Losing plasma water concentrates the red cells you already have. Repeat testing after normal fluid intake often brings the value back inside range with no other change.
What is the most common cause of low hematocrit?
Iron deficiency anemia leads in the United States, driven by menstrual loss, pregnancy demand, and slow gastrointestinal bleeding. B12 deficiency, folate deficiency, chronic kidney disease, and chronic inflammation account for most of the remainder.
What is the difference between hematocrit and hemoglobin?
Hemoglobin measures the oxygen-carrying protein inside red cells, reported in g/dL. Hematocrit measures the share of blood volume those cells occupy, reported as a percentage. They usually move together, with hematocrit running near three times the hemoglobin number.
Does living at high altitude raise hematocrit?
Yes. Lower oxygen pressure prompts the body to build more red cells, so long-term residents of high-elevation cities carry higher baseline values. WHO revised its altitude adjustment approach in 2024 to reflect broader population data.
What is a normal hematocrit during pregnancy?
Hematocrit falls during pregnancy because plasma volume expands faster than red cell mass. CDC and ACOG define anemia as below 33 percent in the first and third trimesters and below 32 percent in the second, with average values near 34 percent late in a single pregnancy.
Why is my hematocrit low but my hemoglobin normal?
Hematocrit is calculated from red cell count and average cell size, so unusually small or large cells can shift it while hemoglobin holds steady. Borderline mismatches between the two are common and often reflect cell size rather than a new condition.
Does testosterone therapy raise hematocrit?
It does, predictably and by dose. Endocrine Society guidance defines therapy-related erythrocytosis at above 54 percent. Reported rates vary sharply by formulation, from under 1 percent in the TRAVERSE gel trial to 22 percent in the T4DM injection trial.
How quickly can hematocrit change?
Hydration shifts can move it within hours. Red cell production changes take weeks, since new cells need roughly seven days to mature and mature cells live about 120 days. After acute bleeding, the value can stay misleadingly normal for several hours.
Medical Disclaimer
This article is for general information only and does not provide medical advice, diagnosis, or treatment. Hematocrit results must be interpreted alongside your full lab panel, symptoms, medical history, medications, and the reference range issued by your own laboratory. Talk with a licensed healthcare professional about your specific results before making any decision about your health.
References
- Hemoglobin and Hematocrit, Clinical Methods, NCBI Bookshelf, NIH
- Anemia Prevalence: United States, August 2021 to August 2023, NCHS Data Brief No. 519, CDC
- Hematocrit Test: What It Is, Levels, and High and Low Range, Cleveland Clinic
- Hematocrit and Hemoglobin, American Red Cross
- Polycythemia, StatPearls, NCBI Bookshelf, NIH
- Hematocrit: Reference Range, Interpretation, Collection and Panels, Medscape
- Testosterone Therapy in Men With Hypogonadism: An Endocrine Society Clinical Practice Guideline
- Diagnosis, Management, and Outcomes of Drug-Induced Erythrocytosis, Blood Advances, American Society of Hematology
- Erythrocytosis in a Large Cohort of Trans Men Using Testosterone, Journal of Clinical Endocrinology and Metabolism
- Testosterone Therapy-Induced Erythrocytosis: Can Phlebotomy Be Justified, Endocrine Connections
- How I Treat Anemia in Pregnancy: Iron, Cobalamin, and Folate, Blood, American Society of Hematology
- Anemia in Pregnancy, Merck Manual Professional Edition
- Hematocrit, UF Health
- Updated Anaemia Estimates: Implications for Global Monitoring, The Lancet Haematology
- Identifying and Treating Iron Deficiency Anemia in Pregnancy, ASH Education Program