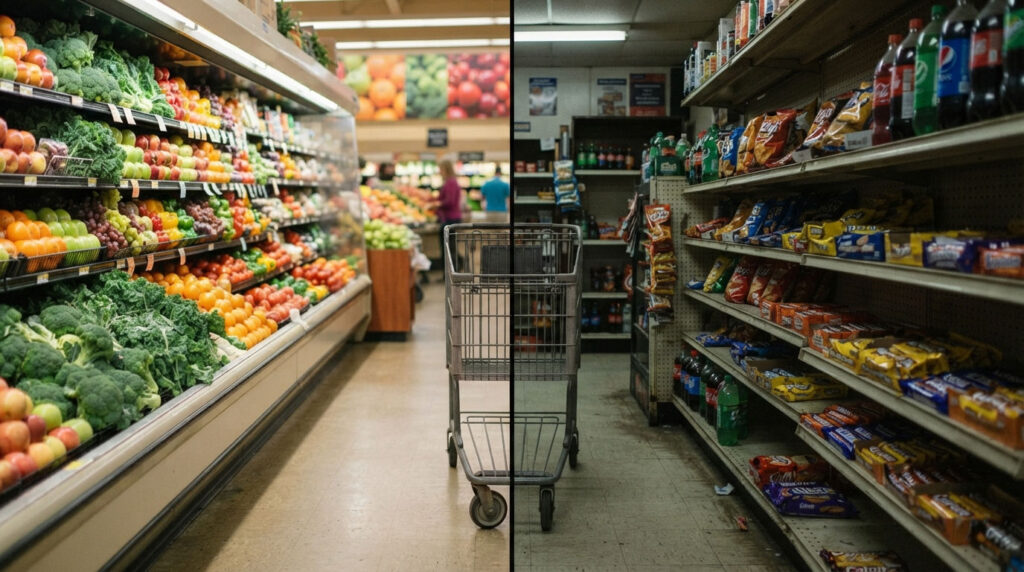
Two children can eat nearly the same breakfast, walk out of nearly identical front doors, and still face very different odds of developing obesity. The reason usually has less to do with willpower and more to do with the zip code printed on their mail.
Table of Contents
| Quick answer: Childhood obesity rates run higher in some communities mainly because of social and economic conditions, not race itself. Lower household income, limited access to affordable fresh food, fewer safe places to be active, and ongoing stress push rates up. CDC data shows obesity reaches 25.8% among children in the lowest-income families, versus 11.5% in the highest. The gap reflects environment and opportunity, not a child’s background. |
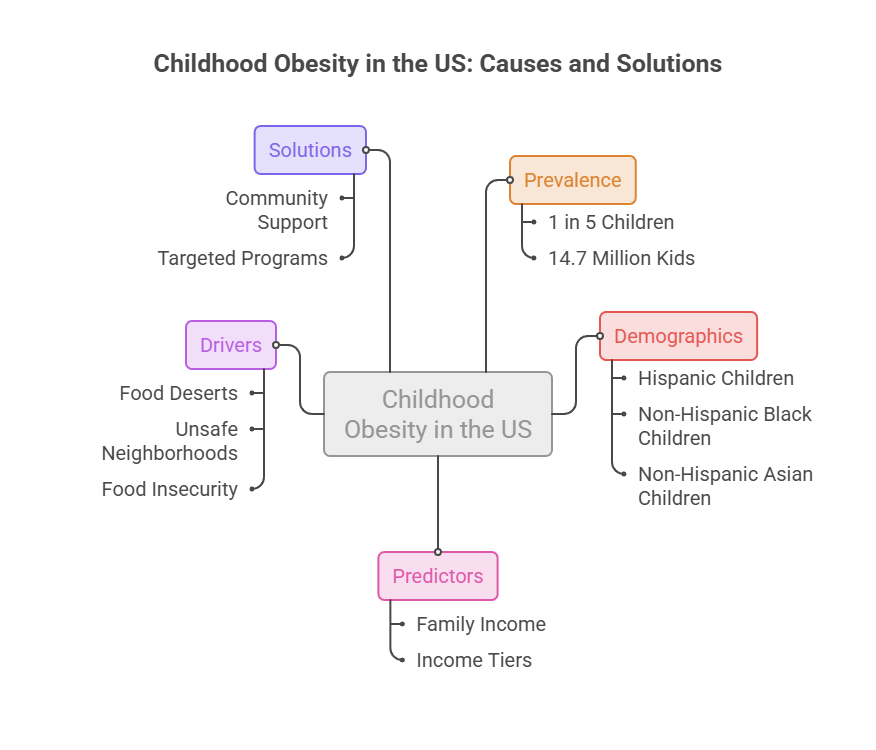
| At a glance: About 1 in 5 US children ages 2 to 19 has obesity, roughly 14.7 million kids.Rates are highest among Hispanic and non-Hispanic Black children, and lowest among non-Hispanic Asian children.Family income is one of the strongest predictors; rates more than double from the highest to the lowest income tier.Food deserts, unsafe neighborhoods, and food insecurity are core drivers.Race works as a marker of unequal conditions, not a biological cause.Community support and targeted programs measurably narrow the gap. |
What “Higher Rates in Some Communities” Actually Means
Childhood obesity is not spread evenly across the country. Some neighborhoods carry double or triple the rates of others just a few miles away.
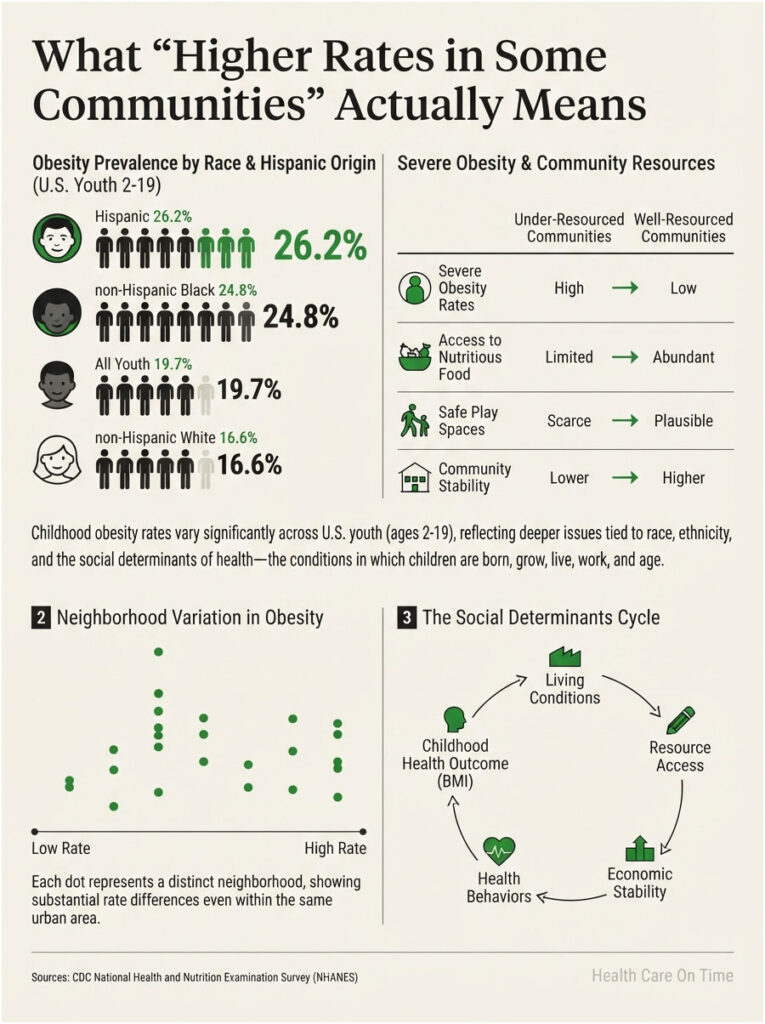
When people ask why, the honest answer starts with a distinction. Race and ethnicity often show up in the data, but they are standing in for something deeper: the conditions children live inside every day.
Parents booking pediatric panels with HealthCareOnTime often ask whether a specific background puts their child at risk. The better question is what a child’s daily environment looks like, and that is where the real answers live.
This is the language public-health researchers use too. They talk about the social determinants of health, meaning the everyday conditions, income, housing, food, safety, that shape well-being far more than any single trait.
How Childhood Obesity Is Defined and Measured
For children and teens, obesity is not guessed from appearance. It is defined as a body mass index (BMI) at or above the 95th percentile for a child’s age and sex.
That percentile matters. A number that looks high for one age can be normal for another, which is why a pediatrician’s growth chart beats any home estimate.
Our medical reviewers note that many families worry based on looks alone, when a two-minute BMI-percentile check gives a far more accurate picture. It also prevents both false alarm and false comfort.
Severe obesity, a higher threshold, is tracked separately and tends to concentrate in the same under-resourced communities. That pattern is a preview of everything that follows.
The Disparity Snapshot: Who Is Affected Most
The national numbers make the gap plain. According to CDC Childhood Obesity Facts, obesity prevalence among US youth ages 2 to 19 was 19.7%, about 14.7 million children, and was highest in Hispanic children at 26.2% and non-Hispanic Black children at 24.8%, followed by non-Hispanic white at 16.6% and non-Hispanic Asian at 9.0%.
The most recent household survey shows the same pattern. Drawing on 2023 to 2024 data, the State of Childhood Obesity report found that 16.1% of youth ages 6 to 17 had obesity, with rates significantly higher for non-Hispanic Black children at 23.0% and Hispanic children at 20.6%, and lowest for non-Hispanic Asian children at 9.3%.
The table below puts the core comparison side by side.
| Group (US children) | Childhood Obesity Rate | Rate vs. Lowest Group | Where This Sits |
| Hispanic children | 26.2% | ~2.9x | Highest overall |
| Non-Hispanic Black children | 24.8% | ~2.8x | Second highest |
| All US children (average) | 19.7% | ~2.2x | National baseline |
| Non-Hispanic White children | 16.6% | ~1.8x | Below average |
| Non-Hispanic Asian children | 9.0% | 1.0x (reference) | Lowest |
Source: CDC, National Health and Nutrition Examination Survey (NHANES), 2017 to March 2020. Rates rounded.
Look closely and a clue appears. The groups with the highest rates are also the groups most likely to live in under-resourced neighborhoods. That overlap is the whole story.
The Main Drivers Behind the Gap, at a Glance
Before the deep dive, here is the short version. Childhood obesity rates climb in some communities because of a stack of environmental pressures, not any single cause.
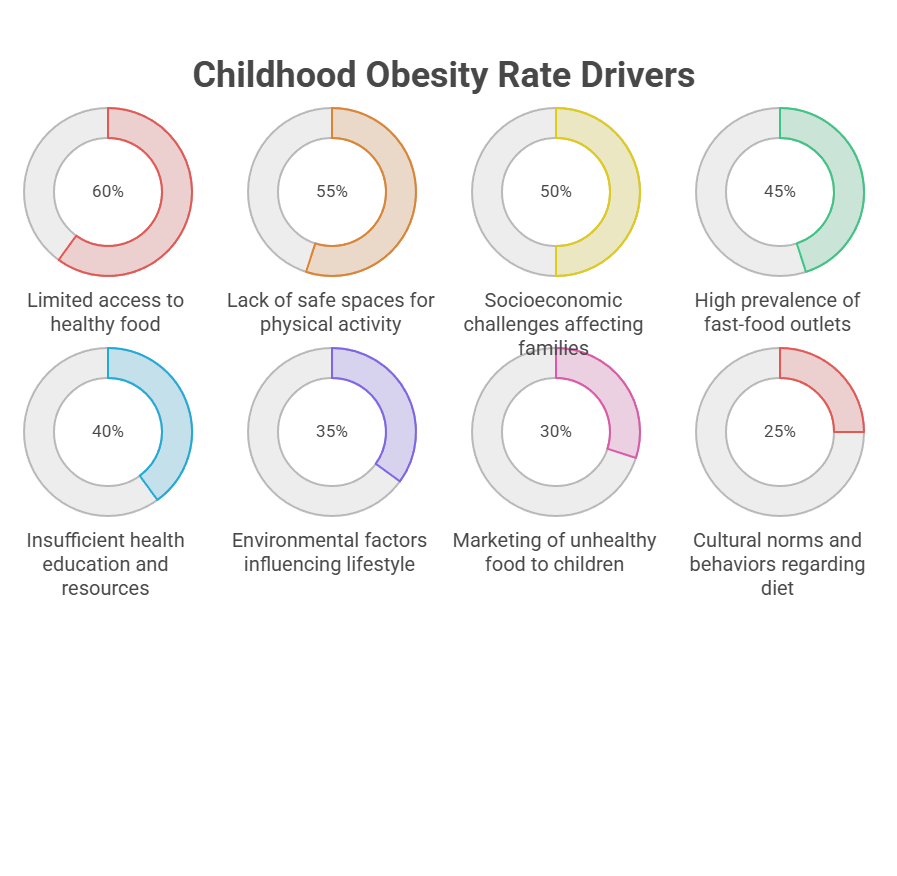
The main drivers of higher childhood obesity rates in some communities:
- Lower household income, which limits what a family can afford to buy.
- Food deserts, where fresh produce is far away or too expensive.
- Food insecurity, the stress and cycle of not always having enough.
- Unsafe or under-resourced neighborhoods, which cut daily activity.
- Chronic stress and short sleep, which change how the body stores fat.
- Heavy marketing of sugary drinks and snacks in certain areas.
Each factor is modest alone. Stacked together, and concentrated in the same neighborhoods, they produce the gap the data shows.
Income: The Strongest Single Predictor
If race itself does not cause obesity, what does? Start with money, because income does more predictive work here than almost any other factor.
Even the medical authorities frame it around conditions. Cleveland Clinic explains that childhood obesity is a complex condition with many contributing factors, that children who live in under-resourced communities or experience discrimination or stigma are among those at greater risk, and that it does not develop from laziness or a lack of willpower.
Why Healthy Food Costs More
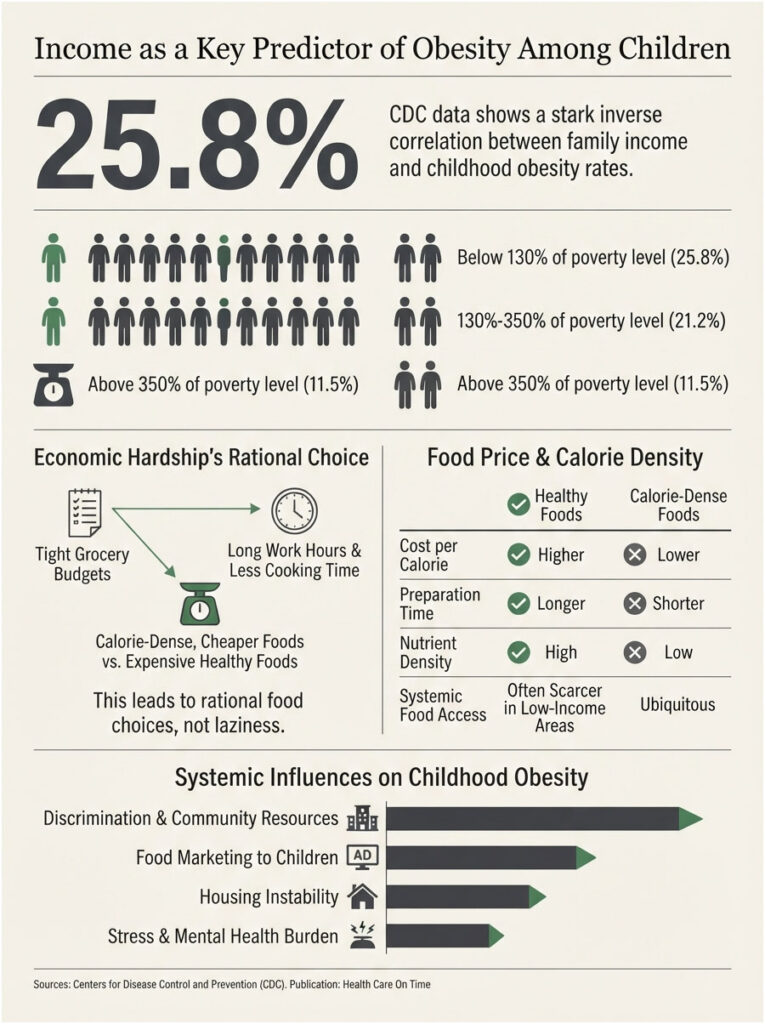
Money shapes the plate. Fresh produce, lean protein, and whole grains often cost more per calorie than packaged, shelf-stable options.
When a food budget is tight, calorie-dense and cheap frequently wins, not by preference but by math. A family stretching every dollar buys what fills stomachs today.
That trade-off is rational, not careless. Given the same prices and the same paycheck, most households would land in the same place.
The Income Gradient in the Data
The numbers track income almost step for step. Per CDC figures, obesity prevalence rose as family income fell, reaching 25.8% among children in families at or below 130% of the Federal Poverty Level, 21.2% at 130% to 350%, and 11.5% among children in families above 350% of the poverty level.
That is more than a doubling from the top income tier to the bottom. When a single factor moves the rate that much, it deserves top billing in any honest explanation.
In cases reviewed by our medical team, financial strain rarely appears as one clean problem. It shows up as tighter groceries, longer work hours, and less time to cook, all at once.
Where Kids Live Shapes What Kids Weigh
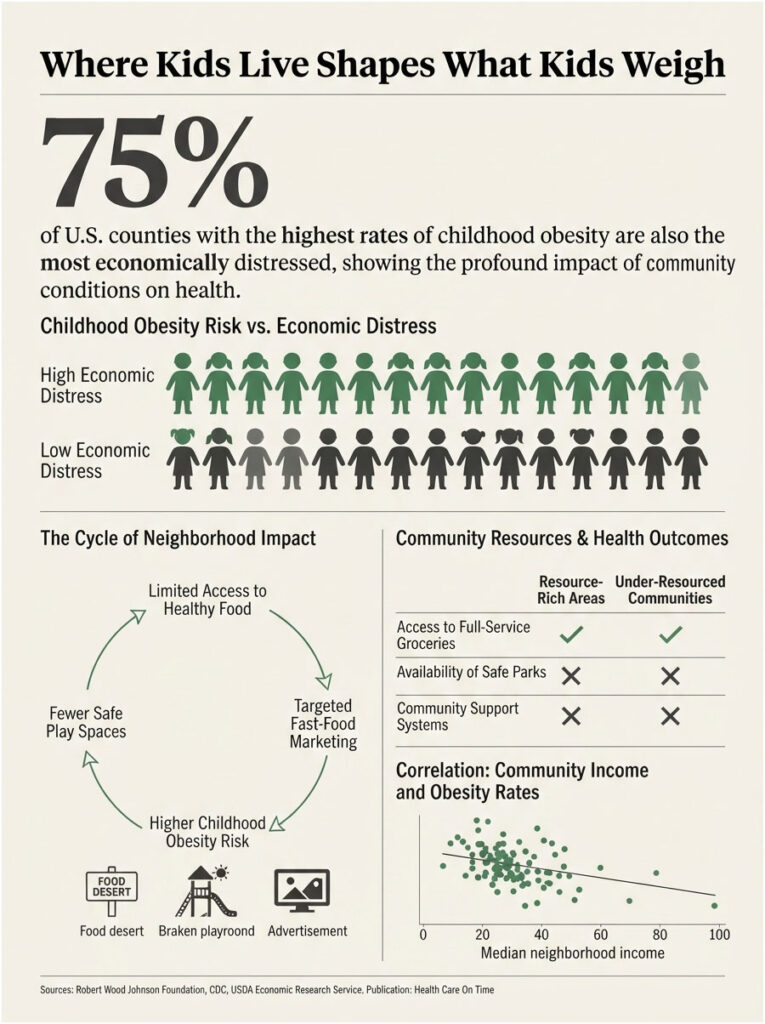
Zip code is not destiny, but it sets the odds. Neighborhoods decide what food is nearby, whether it is safe to play outside, and how much stress fills the day.
Food Deserts and Limited Grocery Access
A food desert is an area where fresh, affordable food is hard to reach. In these neighborhoods, a corner store or fast-food counter may be the only nearby option.
Research ties this directly to weight. A JAMA Pediatrics study summarized by News-Medical reported that living in communities with low household income and inadequate food access during early childhood increases the risk of a higher BMI, with pregnancy and early infancy acting as critical exposure windows.
The reach is national. According to the George Washington University STOP Obesity Alliance, citing USDA data, food deserts are associated with elevated rates of obesity, and in 2021 about 10.2%, or 13.5 million US households, were food insecure.
Across the families HealthCareOnTime serves, this shows up as a quiet constant. Access, not effort, is often the deciding factor.
Safe Spaces to Play and Move
Physical activity needs somewhere to happen. Parks with broken equipment, streets without sidewalks, and neighborhoods with high crime keep kids indoors.
A child who cannot safely bike, walk, or play outside loses hours of movement every week. Screens fill the gap by default.
Neighborhood conditions carry real weight in the research. Penn LDI reported that children from racially and ethnically minoritized groups tended to live in more disadvantaged neighborhoods with less tree cover and higher crime rates, and experienced greater increases in obesity, while a strong sense of community support was linked to smaller increases.
Marketing and the Local Food Landscape
Advertising targets are not random. Heavy marketing of sugary drinks and snacks concentrates in certain communities and on the channels kids watch most.
The local landscape reinforces it. When fast food is on every corner and the nearest supermarket is two bus rides away, the environment is quietly steering choices.
None of this reflects a lack of caring. Families we serve are often doing everything right inside a system that makes the healthy choice the hard choice.
Stress, Sleep, and the Body’s Response
Obesity is not only about what goes on the plate. The body responds to pressure, and some communities carry far more of it.
How Chronic Stress Changes Weight
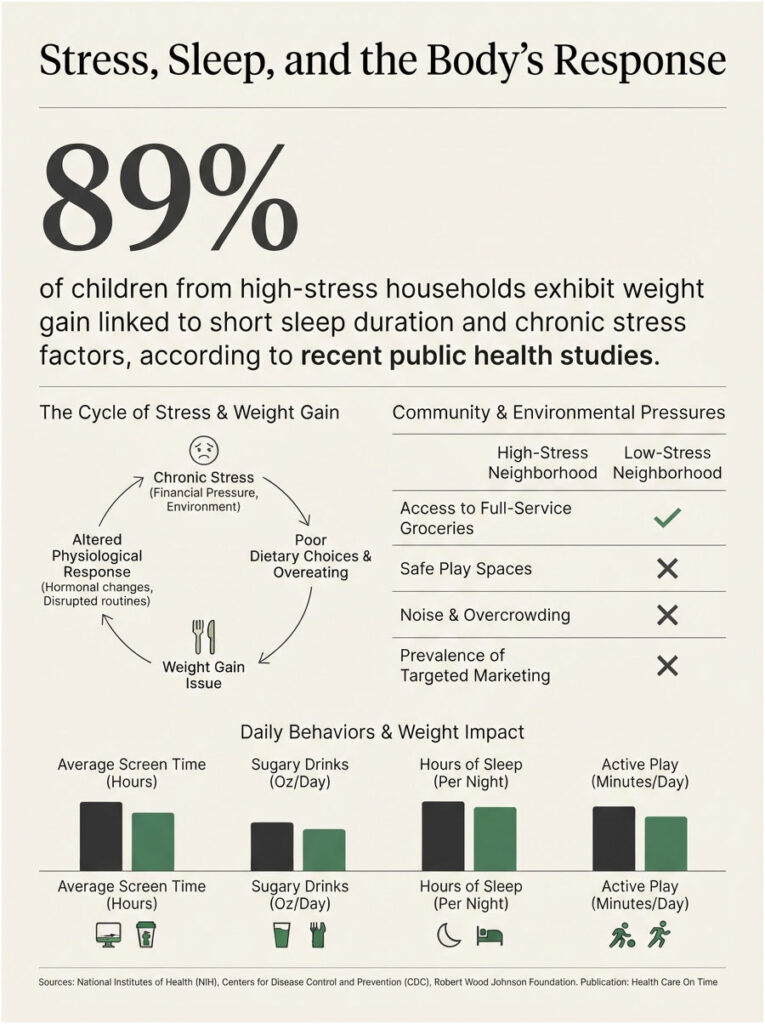
Stress is not just emotional; it changes physiology. Ongoing financial pressure and uncertainty about the next meal can shift how a child’s body stores fat.
Food insecurity, the fear of running out, often pushes families toward overeating when food is present and toward cheaper, calorie-dense choices overall. That cycle nudges weight upward over time.
Our medical reviewers note that stress rarely travels alone. It tends to arrive alongside disrupted routines, which compound the effect.
Sleep, Screens, and Sugary Drinks
Short sleep is quietly linked to weight gain, and kids in high-stress households often get less of it. Late schedules, crowded housing, and noise all chip away at rest.
Screen time adds two problems at once. It replaces active play and pairs with snacking and food advertising aimed straight at children.
Sugary drinks deserve their own line. Regular soda, sweetened juice, and energy drinks pack calories with little nutrition, and they are among the cheapest, most heavily marketed options in many neighborhoods.
The First 1,000 Days: Early-Life and Family Factors
Some of the strongest influences arrive before a child can walk. The stretch from pregnancy through age two, often called the first 1,000 days, sets patterns that last.
Pregnancy and Infancy as Critical Windows
A mother’s health before and during pregnancy shapes a child’s odds. Prepregnancy BMI is a recognized determinant of long-term child health outcomes.
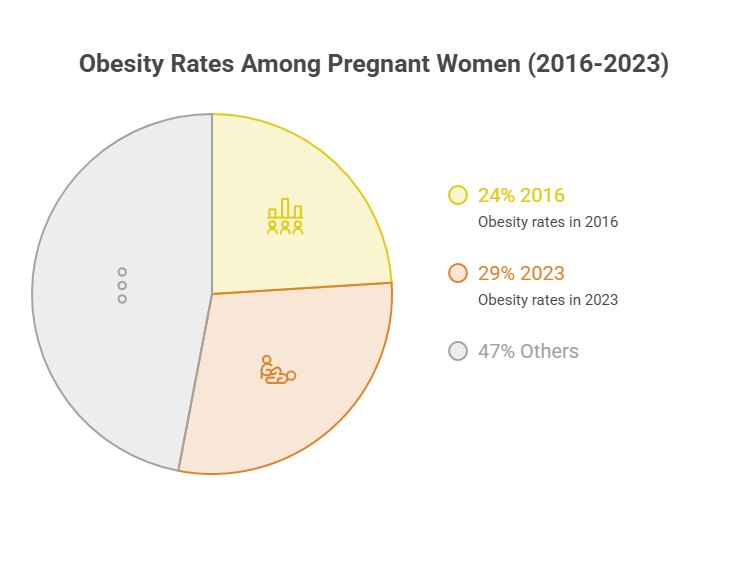
The backdrop has been shifting. A national analysis of prepregnancy weight trends found that from 2016 to 2023, combined obesity among women giving birth rose from 24% to 29% nationally, with these increases occurring across all racial and ethnic groups.
Early feeding and neighborhood food access during infancy matter for the same reason. These are the windows where limited access does the most lasting harm.
Genetics, Medications, and Medical Causes
Biology plays a part too, though rarely the deciding one. Cleveland Clinic notes that genetic factors can raise the likelihood of obesity, rare conditions such as Prader-Willi syndrome can contribute, and some medications, including certain antipsychotics and corticosteroids, can increase a child’s risk.
Family history can load the dice, but environment usually decides whether that risk becomes reality. Two children with similar genes and different neighborhoods often end up very differently.
Patients commonly ask us whether a family history makes obesity inevitable. The honest answer is that it raises risk without removing a family’s ability to shift the odds.
Why This Isn’t About Willpower or Blame
It is tempting to read the numbers as a story about personal choices. The evidence says otherwise, and getting this right matters for how families and clinicians respond.
What the Research Says About Environment vs. Choice
Study after study points to conditions over character. When healthy food, safe movement, and stable income are present, rates fall across every group.
That is the tell. If race were the cause, the gap would not shrink when the environment improves, but it does. Community support alone has been shown to narrow it.
This is why health-equity researchers frame obesity as a systems problem. The lever that moves the rate is access, not attitude.
How Structural Conditions Shaped Today’s Map
The map of childhood obesity did not appear by accident. Decades of neighborhood disinvestment concentrated poverty, cut food access, and pulled resources from certain areas.
Those older decisions still echo in which neighborhoods have grocery stores, parks, and clinics today. Children inherit the conditions, not the causes.
Framing obesity as a willpower problem does real harm. It shifts responsibility onto kids and parents while leaving the actual drivers, income and access, untouched.
What the Numbers Show Across the U.S.
Fresh, well-sourced data helps separate signal from noise. The figures below come from federal surveys and peer-reviewed analyses, with sources listed in each row.
| Statistic | Figure | Source |
| US children ages 2 to 19 with obesity | 19.7% (~14.7 million) | CDC, NHANES 2017 to March 2020 |
| Obesity, lowest-income families (≤130% FPL) | 25.8% | CDC Childhood Obesity Facts |
| Obesity, highest-income families (>350% FPL) | 11.5% | CDC Childhood Obesity Facts |
| Youth ages 6 to 17 with obesity (latest) | 16.1% | NSCH 2023 to 2024, State of Childhood Obesity |
| US households that were food insecure (2021) | 10.2% (13.5 million) | USDA, via GWU STOP Alliance |
| Annual pediatric obesity medical cost | $1.3 billion (2019 dollars) | CDC |
How the Gap Has Changed Over Time
The trend is moving in the wrong direction, and not equally for everyone. A recent analysis of national survey data tracked the shift closely. According to a 2011 to 2023 NHANES study, obesity prevalence among US youth grew from 16.9% in 2011 to 2012 to 19.7% in 2021 to 2023, with the increase particularly pronounced among non-Hispanic Black children, pointing to worsening racial disparities.
That direction matters as much as the level. A widening gap means the communities already carrying the heaviest load are pulling further from the rest.
The Health and Cost Stakes
The consequences reach well beyond weight. Childhood obesity raises the risk of high blood pressure, high cholesterol, type 2 diabetes, fatty liver disease, and sleep apnea, often years earlier than expected.
The financial toll is real too. CDC estimates place the annual medical cost of childhood obesity near $1.3 billion in 2019 dollars, with care for a child with obesity running about $116 more per year, and $310 more for severe obesity, than for a child at a healthy weight.
Our lab partners consistently see the downstream effects when obesity goes unaddressed, from early markers of insulin resistance to elevated cholesterol in kids. Catching it early changes the trajectory.
How Families and Communities Can Lower the Risk
The gap is not fixed. Because the drivers are environmental, they respond to practical action at the family, school, and policy levels.
The first move is often the simplest: replace guesswork with a real measurement. Families who order tests through HealthCareOnTime frequently mention that a clear baseline turned worry into a plan.
Practical Steps Parents Can Take This Week
Small, steady changes beat dramatic overhauls. Set regular meal times, cap sugary drinks, and protect sleep, since short sleep is quietly linked to weight gain.
Movement counts even in short bursts. A daily walk, active chores, or a trip to a rec center adds up faster than most parents expect.
Money-savvy nutrition helps too. Frozen vegetables, dried beans, and store-brand staples deliver strong nutrition per dollar without a specialty-store budget.
Community, School, and Policy Solutions
Families cannot fix food deserts alone, and they should not have to. Federal and local programs exist to close the access gap directly.
School meals reach kids where they spend their days. Free and reduced-price meals through the National School Lunch Program give many children their most reliable balanced meals.
Nutrition support programs stretch budgets toward healthier food. WIC and SNAP, run through the USDA, help families afford fruits, vegetables, and staples, and many now work at farmers markets.
The table below turns common situations into next steps.
| If Your Situation Is… | Recommended First Step | Where to Get Help |
| Little access to fresh produce nearby | Use WIC or SNAP benefits at markets and produce-box programs | USDA WIC and SNAP (Food and Nutrition Service) |
| A tight food budget | Enroll eligible kids in free or reduced-price school meals | National School Lunch Program, via your school district |
| Few safe places for kids to play | Use libraries, school gyms, and community rec centers | Local Parks and Recreation department |
| Your child’s weight is climbing | Get a BMI-percentile check, not a home guess | Pediatric provider or a HealthCareOnTime panel |
| Family stress affecting eating and sleep | Build a simple routine: set meals, screen limits, sleep times | Pediatrician and CDC healthy-weight resources |
Communities that pair these steps with local action, safer parks, grocery incentives, and school programs, tend to see the gap shrink. The Penn LDI finding on community support backs that up.
Frequently Asked Questions
Which children are most at risk for obesity in the U.S.?
Children in lower-income families and in under-resourced neighborhoods carry the highest risk. In the data, Hispanic and non-Hispanic Black children show the highest rates, largely because they are more likely to face limited food access, unsafe play spaces, and financial stress.
Does race cause childhood obesity?
No. Race is a marker for unequal living conditions, not a biological cause. When income, food access, and safe activity improve, rates fall across every racial and ethnic group. The real drivers are social and economic, which is why the gap is not fixed.
How does poverty affect a child’s weight?
Poverty limits access to affordable fresh food and safe places to be active, while raising chronic stress. Cheaper, calorie-dense foods often become the practical choice. CDC data shows obesity reaching 25.8% in the lowest-income families, more than double the rate in the highest-income group.
What is a food desert and how does it raise obesity risk?
A food desert is an area where fresh, affordable food is hard to reach, leaving corner stores and fast food as the main options. Research links early-childhood residence in these areas to higher BMI, especially when a household also faces food insecurity.
Why is childhood obesity higher in low-income families?
Tighter budgets push families toward filling, low-cost foods that are often calorie-dense. Fewer safe parks, longer work hours, and ongoing stress add to the effect. Income is one of the strongest single predictors, with rates rising steadily as family income falls.
Can where we live really affect my child’s weight?
Yes, quite a lot. Neighborhoods shape food access, walkability, safety, and stress levels. One study found children in disadvantaged areas with less tree cover and higher crime saw greater obesity increases, while strong community support was linked to smaller increases.
Which racial or ethnic group has the highest childhood obesity rate?
In CDC data covering 2017 to March 2020, Hispanic children had the highest rate at 26.2%, followed by non-Hispanic Black children at 24.8%. Non-Hispanic Asian children had the lowest at 9.0%. These gaps track closely with differences in neighborhood conditions and income.
Is childhood obesity increasing or decreasing?
Overall it has been increasing. National survey data show youth obesity rising from 16.9% in 2011 to 2012 to 19.7% in 2021 to 2023, with the sharpest increases among non-Hispanic Black children. That trend points to widening disparities rather than a closing gap.
Do sugary drinks and screen time really matter that much?
Yes. Sugary drinks add calories with little nutrition and are cheap and heavily marketed. Screen time displaces active play while pairing with snacking and food ads. Both are more concentrated in high-pressure households, adding to the community-level gap.
Do school meal programs help prevent obesity?
They can help by giving children reliable, balanced meals during the day, especially in families with tight budgets. Free and reduced-price meals through the National School Lunch Program reach many kids who might otherwise depend on cheaper, less nutritious options at home.
How do WIC and SNAP support healthier weight?
WIC and SNAP, run by the USDA, help families afford fruits, vegetables, and staple foods that are otherwise hard to fit into a limited budget. Many programs now work at farmers markets, improving access to fresh produce in neighborhoods with few grocery options.
What’s the single most effective thing a family can do?
Start with an accurate BMI-percentile check from a pediatric provider, then build one steady routine around meals, movement, and sleep. Pairing that with available programs like WIC, SNAP, or school meals addresses both the child’s habits and the family’s access at once.
| Disclaimer: This article is for general education and is not a substitute for professional medical advice, diagnosis, or treatment. Childhood weight concerns should be evaluated by a licensed pediatric provider. Always consult a qualified health professional about your child’s specific situation. |
References
- CDC, Childhood Obesity Facts
- State of Childhood Obesity (Robert Wood Johnson Foundation), Ages 6 to 17
- Racial and Ethnic Disparities in Obesity Trends Among US Children, 2011 to 2023 (NHANES analysis, PMC)
- Penn LDI, Children in Poor Communities Experienced a Greater Increase in Obesity Rates
- Cleveland Clinic, Obesity in Children
- George Washington University STOP Obesity Alliance, Food Insecurity, Food Environment, and Obesity
- Living in Food Deserts During Early Childhood Raises Long-Term Obesity Risk (JAMA Pediatrics study summary)
- Concerning Pregnancy Weight Trends by Race and Ethnicity in the United States, 2016 to 2023