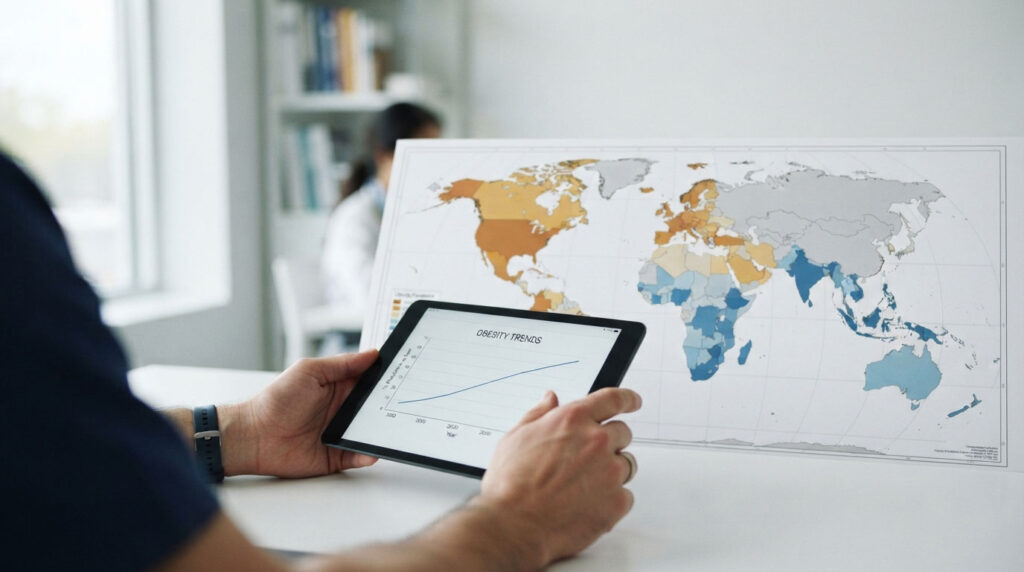
Something strange is happening with the world’s waistline. America’s obesity rate just fell for the first time in over a decade. Almost everywhere else, it’s still climbing.
Table of Contents
Quick answer: In 2022, more than 1 billion people, roughly 1 in 8 worldwide, were living with obesity, according to the World Health Organization and a landmark study in The Lancet. Adult obesity has more than doubled since 1990. The United States leads wealthy nations at about 40%, yet it’s now one of the few places where rates are falling, driven largely by GLP-1 medications. Globally, the trend still points up, fastest in low- and middle-income countries.
At a Glance
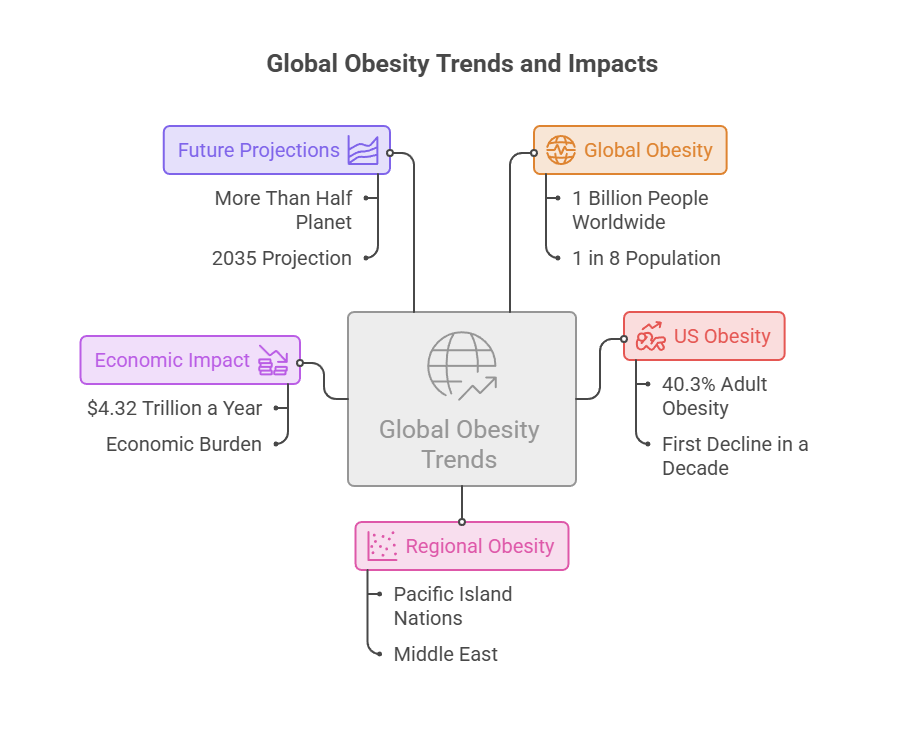
- Over 1 billion people worldwide had obesity in 2022, about 1 in 8 of the entire population.
- US adult obesity sits near 40.3%, more than double the global adult rate of roughly 16%.
- America’s rate recently fell for the first time in a decade while global rates keep rising.
- Pacific island nations and parts of the Middle East carry the heaviest burden, some above 60%.
- Obesity could cost the world economy $4.32 trillion a year by 2035.
- Without change, more than half the planet may be overweight or obese by 2035.
Obesity was long filed away as a rich-country problem. That framing is now outdated. The condition reaches nearly every nation, climbs fastest where health systems are least prepared, and shapes everything from heart disease rates to national budgets.
This guide breaks down what the global obesity numbers actually say, why they’ve moved so sharply since 1990, how the US stacks up against the world, and what the freshest data means for you. Real figures, real sources, no filler.
What “Obesity” and “Global Trends” Actually Mean
Before the numbers make sense, the definitions have to be clear. Obesity isn’t a loose label. It’s a measurable clinical threshold applied the same way across most countries.
How obesity is defined
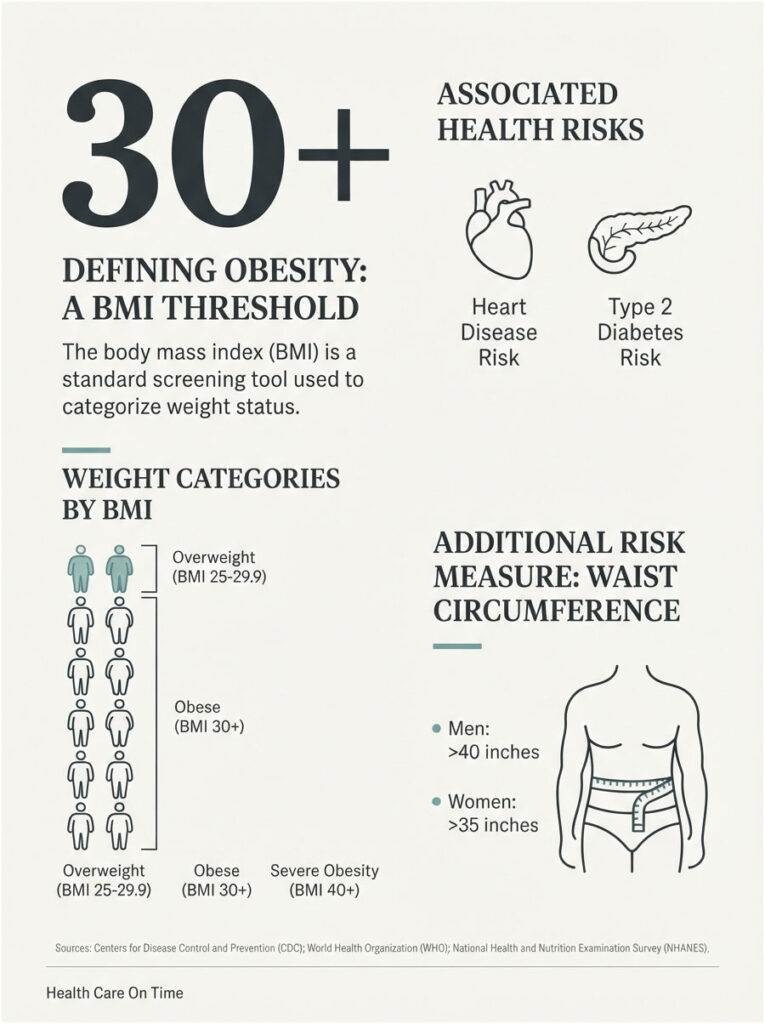
Doctors and researchers use body mass index, or BMI, a ratio of weight to height. A BMI of 30 or higher counts as obesity. A BMI of 40 or higher is classified as severe obesity by the CDC.
BMI has limits. It doesn’t separate muscle from fat, so a lean athlete can read “overweight.” At the population level, though, it tracks health risk well enough to serve as the global standard.
Overweight versus obese versus severe
The categories stack. A BMI of 25 to 29.9 is overweight. Thirty and up is obese. Forty and up is severe. Each step higher raises the odds of type 2 diabetes, heart disease, and other chronic conditions.
That distinction matters when reading headlines. When the WHO says 2.5 billion adults were overweight in 2022, that count includes everyone at BMI 25 and above. The narrower obesity figure, BMI 30-plus, was about 890 million adults.
Beyond BMI: waist and body composition
BMI isn’t the only measure that matters. Waist circumference captures visceral fat, the deep abdominal fat most tightly tied to heart disease and diabetes. A waist over 40 inches in men or 35 inches in women signals higher risk even at a lower BMI.
Newer clinical guidance increasingly pairs BMI with waist size and lab markers for a fuller read. Among the panels our lab partners run, waist-linked results like fasting glucose and triglycerides often flag risk the scale alone misses.
How the world keeps score
Global tracking relies on physical measurement rather than guesswork. The NCD Risk Factor Collaboration, coordinated through Imperial College London and the WHO, pooled data from thousands of studies across nearly 200 countries.
In the US, the gold standard is NHANES, the National Health and Nutrition Examination Survey, which measures participants directly instead of asking them to self-report. Across the metabolic panels our lab partners process, measured weight almost always runs higher than what people estimate on their own.
Consistency in method is what makes global comparison possible. Because most countries now use the same BMI thresholds and similar survey techniques, a rate in one nation can be compared meaningfully to another. That shared yardstick lets researchers say obesity has doubled worldwide with confidence.
The Big Picture: How Many People Have Obesity Worldwide
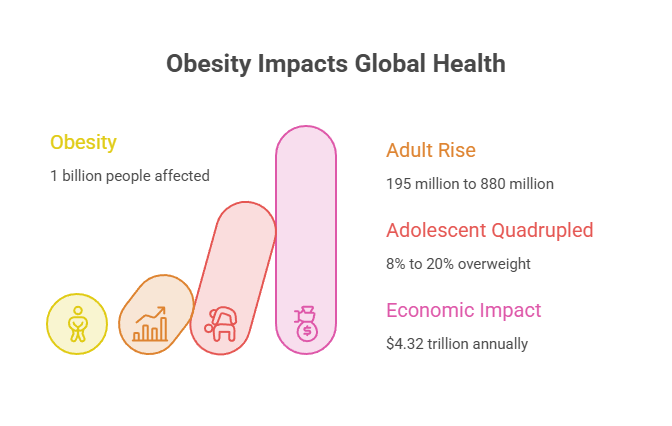
The most-cited statistic is blunt. In 2022, more than 1 billion people on Earth were living with obesity, about 1 in 8 of the whole population.
The one-billion milestone
That billion splits into roughly 880 million adults and 159 million children and adolescents aged 5 to 19, per the Lancet analysis. Back in 1990, the adult figure stood near 195 million.
In a little over three decades, the number of adults with obesity multiplied more than four and a half times. Population growth explains part of that, but not most. The rate itself climbed steeply.
The 30-year climb
Among men, global obesity rose from 4.8% in 1990 to 14.0% in 2022. Among women, it went from 8.8% to 18.5%, according to the Obesity Evidence Hub drawing on the same NCD-RisC dataset.
Children saw a faster shift. Adolescent obesity roughly quadrupled since 1990, and overweight among those aged 5 to 19 jumped from 8% to 20%. Clinicians on our medical review team point to that youth trend as the most worrying figure in the whole dataset.
The momentum matters as much as the milestone. For decades, obesity rose steadily rather than spiking, which made it easy to overlook year to year. Small annual increases compounded into a doubling, which is exactly why experts warn against treating today’s numbers as a plateau.
There’s a twist in the global picture too. Many countries now carry both obesity and undernutrition at once, a pattern researchers call the double burden of malnutrition. A single household can hold an overweight parent and an underweight child, most often across South Asia and sub-Saharan Africa.
The table below gathers the headline numbers in one place, sources attached.
| Statistic | Figure | Source |
| People worldwide with obesity (2022) | 1 billion+ (about 1 in 8) | WHO / The Lancet |
| Adults worldwide with obesity | ~880 million | NCD-RisC / Lancet |
| US adults with obesity (2021–2023) | 40.3% (100M+ people) | CDC NHANES |
| US adults using GLP-1 for weight loss (2025) | 12.4% | Gallup |
| Projected global economic impact by 2035 | $4.32 trillion/year | World Obesity Federation |
Why Obesity Is Rising Almost Everywhere
If the trend were confined to one region or one diet, it would be simpler to explain. It isn’t. Obesity is climbing across rich and poor nations alike, which points to shared, structural causes.
The food-system shift
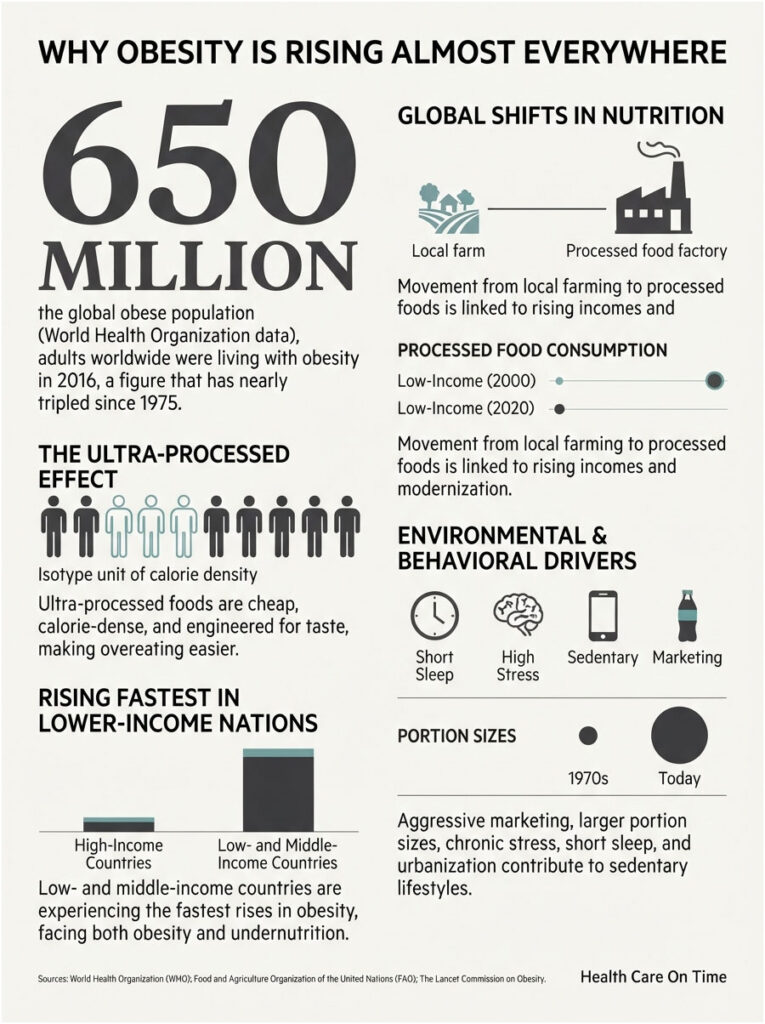
The biggest driver is what and how much people eat. As incomes rose worldwide, food systems moved away from local, subsistence farming toward transported, commercial, heavily processed products.
The World Economic Forum, citing the Lancet study, described a simple pattern. People in low- and middle-income countries now eat more calories, more animal products, and more sugar than a generation ago.
Ultra-processed foods sit at the center of this. They’re cheap, calorie-dense, engineered for taste, and easy to overeat. That combination is hard to counter with willpower alone.
Portion sizes tell part of the story. Restaurant servings, packaged snacks, and sugary drinks have grown larger over the decades, resetting what looks like a normal amount. When bigger portions become the default, people eat more without feeling like they changed anything.
Sleep, stress, and marketing
Diet and movement aren’t the whole story. Chronic short sleep and high stress both push appetite hormones toward weight gain, and both have worsened in modern life. Aggressive marketing of sugary drinks and snacks, often aimed at children, adds steady pressure.
Sugar-sweetened beverages draw particular scrutiny. They deliver large amounts of sugar with little fullness, which makes them easy to overconsume day after day. Cutting them is one of the highest-impact single changes most people can make.
Urbanization and sedentary living
Cities change how bodies move. Desk jobs replace physical labor. Cars and transit replace walking. Screens fill leisure hours that once involved activity.
A common question our patient-support staff hears is why weight crept up without any obvious change in routine. Usually the environment shifted, from portion sizes to daily step counts, even when personal habits felt steady.
The development paradox
The counterintuitive part is where the rise is now steepest. Obesity is climbing fastest in the places with the fewest resources to manage it.
Why low- and middle-income countries are catching up
Researchers call this a “modernization” effect. Rising GDP per capita, urbanization, and changing labor patterns all track with higher average BMI as countries develop.
The World Obesity Federation found that of the 10 countries with the greatest expected increases in obesity, 9 are low- or lower-middle-income. Many face a double burden, fighting undernutrition and obesity at once.
The U.S. vs the World: A Tale of Two Trends
Here the global story splits in two. America and the rest of the world are moving in opposite directions right now, and the gap is telling.
America the outlier
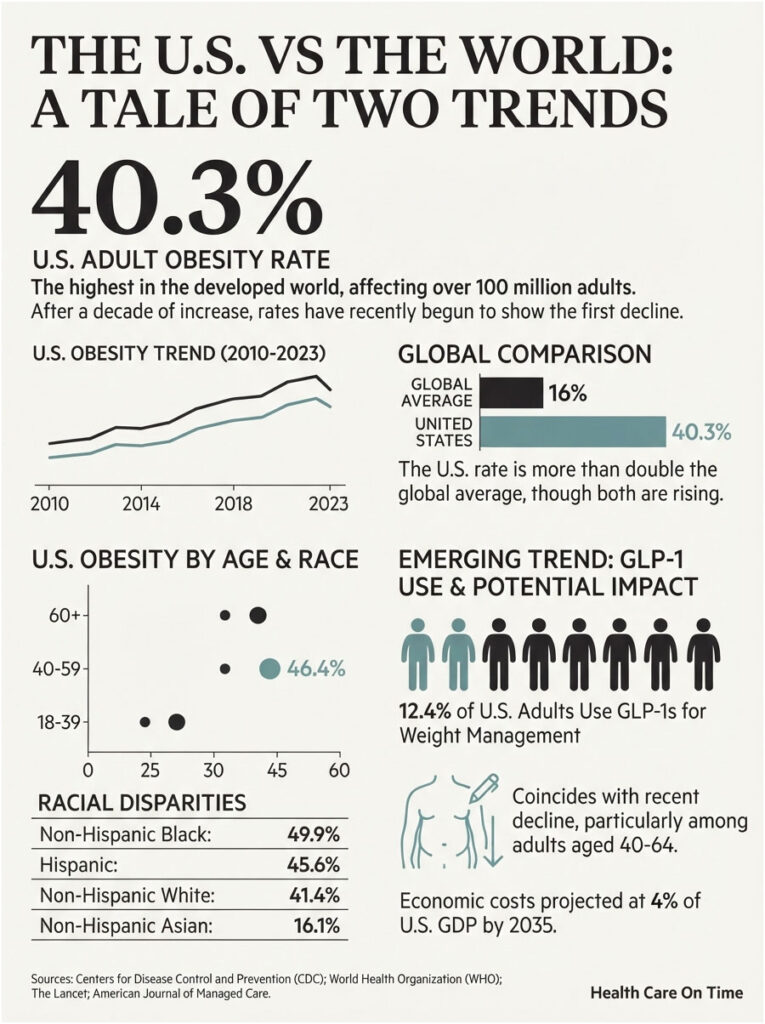
The US carries the highest adult obesity level in the developed world. NHANES data for August 2021 through August 2023 put it at 40.3%, meaning more than 100 million American adults have obesity.
Every US state and territory reported obesity above 20% in 2023, per the CDC. The rate peaks among adults aged 40 to 59, at 46.4%, nearly one in two people in their prime working years.
Rates also differ by group. CDC figures showed obesity at 49.9% among non-Hispanic Black adults, 45.6% among Hispanic adults, 41.4% among non-Hispanic White adults, and 16.1% among non-Hispanic Asian adults.
Why did the US get heavy first? A mix of oversized portions, cheap fast food, car-dependent suburbs, and neighborhoods with limited fresh-food access set the stage decades ago. The burden isn’t spread evenly either. Southern states like Mississippi, West Virginia, and Louisiana report some of the nation’s highest adult rates, while Colorado and Hawaii sit among the lowest.
The turning point
Then the direction changed. After rising almost every year since 2011, the US rate slipped from a peak of 41.9% to 40.3%, the first real pause in over a decade.
A separate Gallup survey tracked the decline further, to about 37% in 2025 from a high near 39.9% in 2022. The sharpest drops appeared in adults aged 40 to 64, the same groups adopting new weight-loss drugs most heavily.
The GLP-1 factor
The likely cause is a class of medications called GLP-1 receptor agonists, sold as Ozempic, Wegovy, Zepbound, and Mounjaro. The share of US adults taking them for weight loss reached 12.4% in 2025, more than double the 5.8% recorded in early 2024.
From cases our medical team has reviewed, the Americans seeing the largest changes tend to pair medication with sustained diet and activity adjustments, not medication alone. For readers weighing this route, our Zepbound and GLP-1 guide explains how these drugs work and who they suit.
The shift raises hard questions. These medications are expensive, often hundreds of dollars a month without insurance, and many people regain weight after stopping. That has sparked debate over access, long-term use, and whether coverage can keep pace with demand. For now, the drugs have proven what’s possible, even if broad access stays unsettled.
The comparison below shows how differently the US and the world are trending right now.
| Measure | United States | Global Average | Highest-Burden Region |
| Adult obesity rate | ~40.3% | ~16% | Pacific islands, 60%+ |
| Recent trend direction | Falling (first in a decade) | Rising | Rising sharply |
| Severe obesity | ~9.7% | Limited data | Very high |
| Projected by 2050 (no action) | 55%+ | 57–60% | Already extreme |
| Economic cost (share of GDP by 2035) | ~4% | ~3% | Americas 3.7% |
Which Countries Are Hit Hardest
The map of obesity isn’t what most Americans picture. The US is high, but it isn’t the summit. Several smaller nations carry far heavier loads.
Pacific island nations
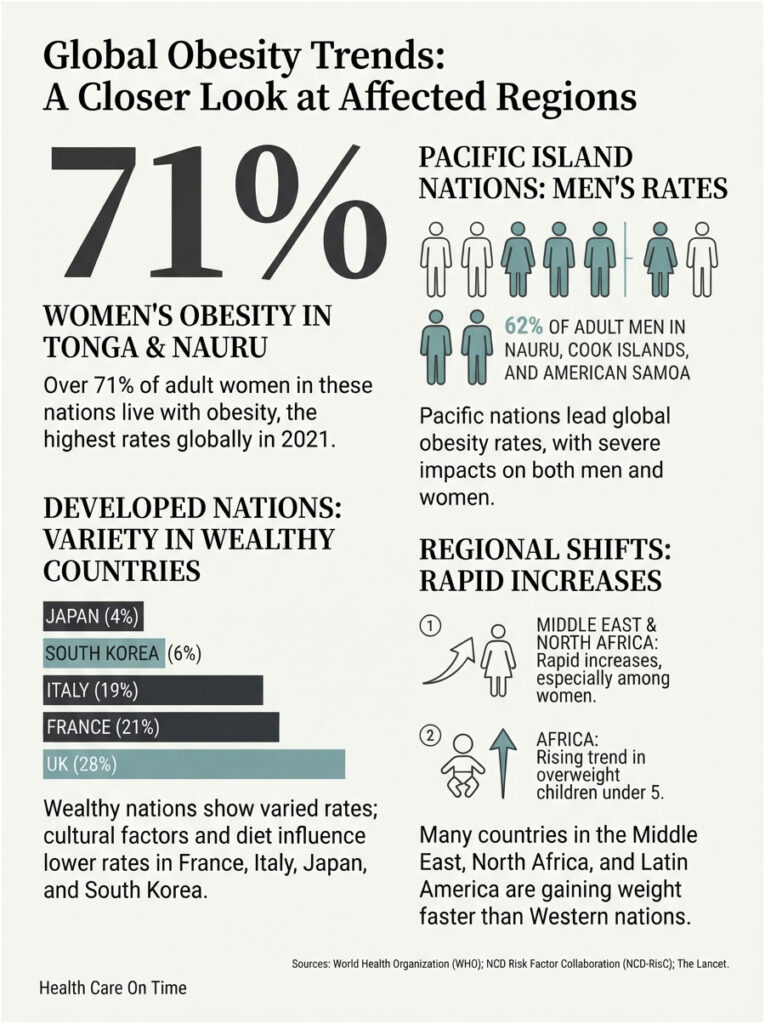
The highest rates on Earth cluster in the Pacific. In the Lancet-linked GBD analysis, more than 62% of adult men in Nauru, the Cook Islands, and American Samoa had obesity in 2021.
Among women, over 71% in Tonga and Nauru were living with obesity. These figures reflect a move away from traditional diets toward imported, processed food, layered onto genetic and economic factors.
The lean developed nations
Wealthy countries vary more than you’d expect. Across Europe, the United Kingdom and parts of central Europe report high rates, while France and Italy stay lower, helped by food culture and portion norms.
In Asia, Japan and South Korea remain among the world’s leanest developed nations, tied to diet, walkable cities, and public-health campaigns. Their example shows that rising income doesn’t have to mean rising obesity.
The Middle East and North Africa
This region shows some of the fastest increases anywhere. The Lancet forecasting study flagged north Africa and the Middle East as areas where obesity prevalence has surged most rapidly, especially among women.
The developing-world surge
Africa is a clear warning sign for coming decades. The number of overweight children under 5 there has climbed sharply since 2000, per the WHO.
Nearly half of children under 5 who were overweight or obese globally live in Asia. Our childhood obesity guide goes deeper on why early-life weight patterns cast such long shadows into adulthood.
The trajectory is the real concern. Countries across the Middle East, north Africa, and parts of Latin America are gaining weight faster than the West did, and often earlier in life. Health systems built to fight infectious disease and hunger now face a chronic-disease wave they weren’t designed for, which is what makes the coming decade pivotal.
The Real Cost: Health and Economic Toll
Obesity’s price appears in two ledgers, your body and the economy. Both are heavy, and both are growing.
The disease burden
Excess weight raises the risk of a long list of serious conditions. Type 2 diabetes, heart disease, stroke, several cancers, kidney disease, and fatty liver disease all track with higher BMI.
The CDC reports that about 58% of US adults with obesity have high blood pressure, and roughly 23% have diabetes. People who contact HealthCareOnTime often underestimate how early these risks surface in routine bloodwork, sometimes years before symptoms appear.
These conditions feed one another. Extra weight raises blood pressure and blood sugar, which in turn strain the heart and kidneys over time. Fatty liver disease, once uncommon, now tracks closely with rising weight and can progress quietly for years before symptoms show.
Why the numbers understate the harm
Obesity rarely acts alone. It clusters with other risk factors, so its true contribution to illness and early death is difficult to isolate and easy to undercount.
The hidden costs
The medical bill is only half the story. Obesity drags on economies through lost productivity, more sick days, and earlier exits from the workforce, costs that often exceed direct treatment.
There’s a human toll too. Weight stigma and its links to depression and anxiety add a burden that rarely appears in spreadsheets but weighs heavily on daily life.
The dollars
The financial toll is steep. In the US, obesity accounted for nearly $173 billion in medical spending in 2019 dollars, with annual costs running about $1,861 higher per person than for adults at a healthy weight.
Globally, the World Obesity Federation projects the economic impact of overweight and obesity will reach $4.32 trillion a year by 2035, close to 3% of global GDP. That roughly matches what the COVID-19 pandemic cost the world economy in 2020.
The table below turns the risk picture into practical steps based on where you stand today.
| Your Situation | What It Means | Recommended Next Step |
| BMI 25–29.9 (overweight) | Elevated but reversible risk | Track your waist, adjust diet, retest in 3–6 months |
| BMI 30+ (obese) | Higher odds of diabetes and heart disease | Ask a doctor about a full metabolic workup |
| Family history plus rising weight | Genetic and lifestyle risk stacking | Get a baseline HbA1c, lipid, and blood pressure check |
| Considering GLP-1 medication | Effective but needs supervision | Discuss eligibility, side effects, and cost with a clinician |
| Normal BMI but sedentary | Possible hidden metabolic risk | Stay active and monitor key labs yearly |
What Happens Next: Projections and the Path Forward
The trend lines don’t stop at today. Forecasts stretch decades ahead, and most point upward unless something changes.
The 2035 and 2050 forecasts
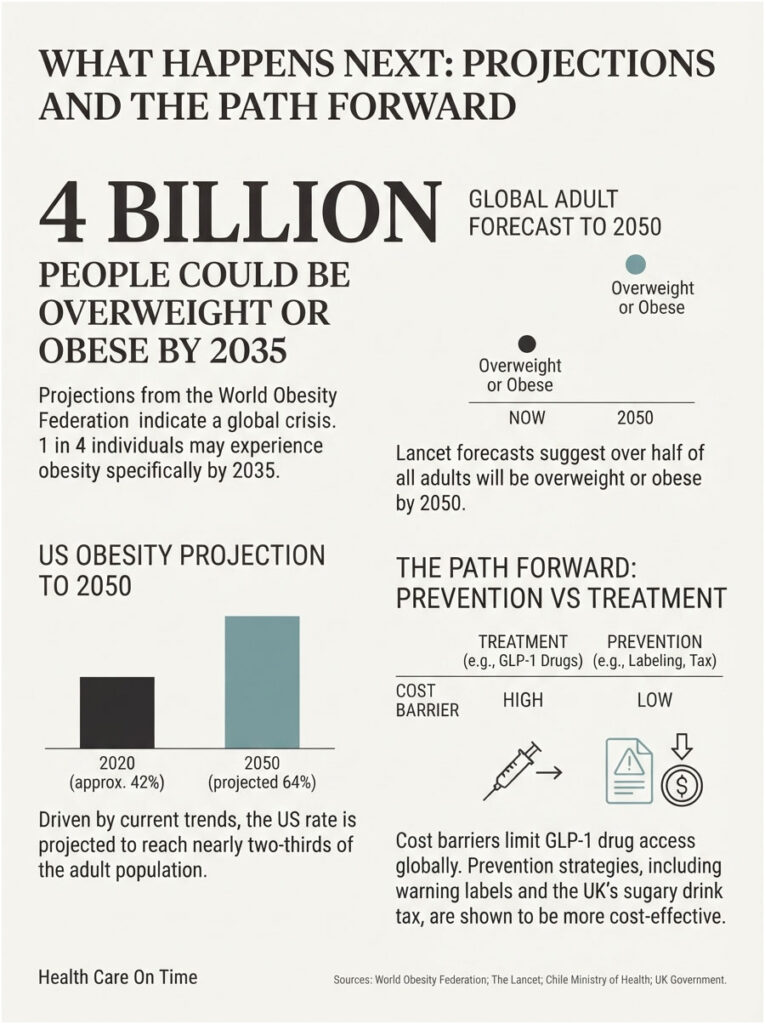
By 2035, over half the global population, about 51% or more than 4 billion people, could be overweight or obese, per the World Obesity Federation. Roughly 1 in 4 would have obesity specifically.
Looking further out, a Lancet forecasting study projects that without policy change, more than half the world’s adults will be overweight or obese by 2050. In the US, one analysis put overweight and obesity at 64% of adults by 2050.
Can the US trend go global?
That remains an open question. GLP-1 drugs bent America’s curve, but access and cost stay steep, especially in lower-income nations.
If half of US adults used these medications, health-care spending could climb dramatically, which keeps prevention central alongside treatment. The trend may spread as prices ease and oral versions arrive, though that outcome is far from certain worldwide.
Cost is the sticking point. Even in the US, insurance coverage for weight-loss drugs is patchy, and many plans exclude them outright. In lower-income countries, where need is climbing fastest, prices stay far out of reach for most people. Closing that gap is the central challenge of the decade ahead.
Prevention that moves the needle
Medication draws headlines, but population-level change leans on policy and environment. Measures like taxing sugar-sweetened beverages, improving food labeling, and widening access to healthy food cost far less than treating the downstream disease.
Some countries offer a playbook. Chile’s bold front-of-package warning labels and marketing limits changed what shoppers put in their carts. The United Kingdom’s tax on sugary drinks pushed manufacturers to cut sugar before it ever reached consumers.
Prevention and treatment aren’t rivals. The strongest national plans pair medical care for people who already have obesity with environmental changes that stop it from taking hold in the next generation. Doing only one leaves the problem half-addressed.
What This Means for You
Global numbers can feel abstract. What matters day to day is where you fall and what you do about it. Early action pays off.
Know your numbers
Start with the basics: your BMI, your waist measurement, and a few key labs. Together these give a clearer read on risk than the bathroom scale alone.
A simple HbA1c and lipid panel often flags rising risk before weight becomes the obvious problem, one reason our diagnostic team recommends checking them early. Catching it sooner leaves more room to act.
Consistency beats intensity here. Checking a few key markers once a year, weight trend, waist, blood pressure, blood sugar, and cholesterol, builds a picture no single reading can. Trends reveal risk long before any one number crosses a red line.
Small, sustainable changes beat crash diets
Extreme plans rarely last. Steady shifts, more whole foods, fewer ultra-processed ones, regular movement, and better sleep, tend to hold over years.
The target isn’t a quick number on the scale. It’s durable metabolic health that lowers long-term odds of diabetes and heart disease.
When to talk to a doctor about medication
If your BMI is 30 or above, or 27-plus with a related condition, GLP-1 medication may be worth discussing. It works best under supervision and alongside lifestyle changes, not as a standalone fix.
A doctor can weigh your eligibility, walk through side effects, and factor in cost before you decide.
Build a support system
You don’t have to do it alone. Support, whether from a doctor, a dietitian, family, or a structured program, consistently improves the odds of lasting change. Weight is shaped by biology and environment as much as effort, so leaning on help isn’t a shortcut, it’s strategy.
Frequently Asked Questions
How many people in the world have obesity?
More than 1 billion people worldwide were living with obesity in 2022, about 1 in 8 of the global population, per the WHO and The Lancet. That includes roughly 880 million adults and 159 million children and adolescents aged 5 to 19.
What percentage of Americans are obese?
About 40.3% of US adults had obesity during 2021 to 2023, according to CDC NHANES data, meaning more than 100 million American adults. That’s down slightly from a peak of 41.9%, but still above the Healthy People 2030 goal of 36%.
Which country has the highest obesity rate?
Small Pacific island nations top the list. In Nauru and Tonga, over 71% of adult women had obesity in 2021, and Nauru, the Cook Islands, and American Samoa exceeded 62% among men. The US ranks high but isn’t the global peak.
Why is obesity increasing worldwide?
The main drivers are shifts in food systems toward cheap, ultra-processed, calorie-dense products, plus urbanization and more sedentary living. Rising incomes let people eat more calories, sugar, and animal products, a pattern now spreading fastest through low- and middle-income countries.
Is obesity going down in the United States?
Slightly, yes. After climbing almost yearly since 2011, US obesity recently fell for the first time in a decade. Gallup tracked a drop to about 37% by 2025, largely tied to GLP-1 weight-loss medications like Ozempic, Wegovy, and Zepbound.
What’s the difference between overweight and obese?
Both use BMI. Overweight means a BMI of 25 to 29.9. Obese means 30 or higher, and severe obesity means 40 or higher. Each step up raises the risk of type 2 diabetes, heart disease, and other chronic conditions.
How is obesity measured across countries?
Researchers pool physically measured height and weight data from population studies, coordinated by groups like the NCD Risk Factor Collaboration with the WHO. This measured approach beats self-reported surveys, which typically undercount real weight.
What is the economic cost of obesity?
In the US, obesity drove nearly $173 billion in medical costs in 2019. Globally, the World Obesity Federation projects the economic impact of overweight and obesity will reach $4.32 trillion a year by 2035, close to 3% of world GDP.
Are GLP-1 drugs like Ozempic reducing obesity?
They appear to be, at least in the US. As GLP-1 use for weight loss more than doubled to 12.4% of adults by 2025, national obesity rates fell for the first time in years. Access and cost still limit their reach globally.
Will obesity rates keep rising?
Globally, forecasts say yes without major change. More than half the world’s adults could be overweight or obese by 2050. The US is a partial exception, where medication has recently reversed the climb, though projections still warn of high rates ahead.
Is childhood obesity rising too?
Yes, and quickly. Adolescent obesity roughly quadrupled worldwide since 1990, and overweight among children aged 5 to 19 rose from 8% to 20%. Nearly half of overweight young children globally live in Asia, with sharp increases across Africa.
What health problems does obesity cause?
Obesity raises the risk of type 2 diabetes, heart disease, stroke, several cancers, kidney disease, and fatty liver disease. CDC data show about 58% of US adults with obesity have high blood pressure and 23% have diabetes.
Disclaimer: This article is for general information and isn’t medical advice. Obesity is a complex, chronic condition, and individual risk varies. BMI is a screening tool, not a diagnosis. Talk with a licensed healthcare provider before starting any weight-loss plan, medication, or major dietary change. If you have concerns about your weight or metabolic health, consider having your key markers tested and reviewed by a qualified clinician.
References
- World Health Organization: Obesity and overweight fact sheet
- Imperial College London / The Lancet: More than one billion people now living with obesity
- CDC NCHS: Obesity and Severe Obesity Prevalence in Adults
- CDC: Adult Obesity Facts
- Gallup: Obesity Rate Declining in U.S.
- World Obesity Federation: Economic impact to surpass $4 trillion by 2035
- Institute for Health Metrics and Evaluation / The Lancet: Overweight and obesity forecasts to 2050
- AJMC: Overweight and Obesity to Affect 64% of Americans by 2050
- World Economic Forum: Why obesity is rising and how we can live healthy lives