
Here is a fact that sounds like a contradiction. Global cancer cases are on track to climb by roughly two-thirds over the next 25 years, and at the same time, an American diagnosed today has better survival odds than at any point in recorded history. Both are true. Understanding why they fit together is the difference between panic and a plan.
Table of Contents
Quick Answer: The World Health Organization projects global cancer cases will rise from 20.6 million a year in 2024 to nearly 35 million by 2050. That is 67% against the precise projection of 34.4 million, or close to 70% against the rounded figure, which is why both numbers appear in the news. Population growth and aging drive nearly all of the rise, not a jump in individual cancer risk.
At a Glance
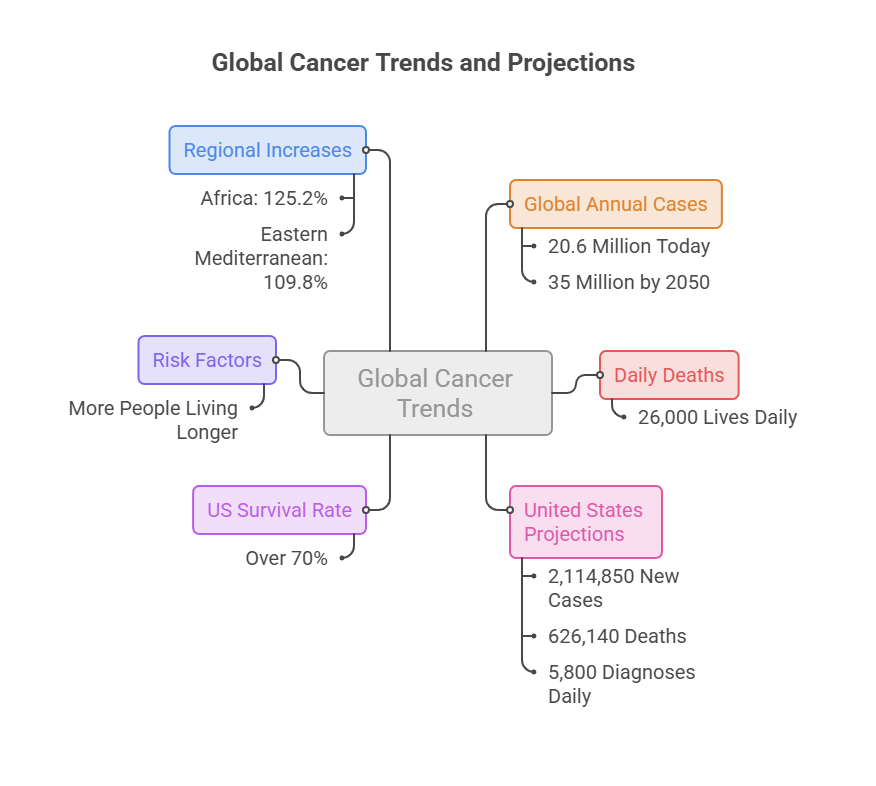
- Global annual cases: 20.6 million today, projected near 35 million by 2050
- Cancer claims more than 26,000 lives worldwide every day
- United States, 2026: 2,114,850 new cases and 626,140 deaths projected, about 5,800 diagnoses a day
- US five-year survival for all cancers combined crossed 70% for the first time
- Nearly four in ten global cancer cases trace to risk factors science already understands
- The rise reflects more people living longer, not a sudden spike in per-person risk
- Africa faces the steepest regional increase at 125.2%, with the Eastern Mediterranean at 109.8%
What the WHO Report Actually Says
On July 8, 2026, the World Health Organization released its Global Status Report on Cancer 2026, produced jointly with the International Agency for Research on Cancer. The figures inside set off a week of alarming headlines.
Our medical reviewers went through the full release rather than the coverage of it, and the gap between the two is worth closing.
The Headline Numbers
Cancer claims more than 26,000 lives every day. With an estimated 20.6 million new cases and close to 10 million deaths annually, cancer remains the second leading cause of death globally, after cardiovascular disease. Lung cancer stays the deadliest form worldwide.
Among men, lung, prostate, and colorectal cancers carry much of the burden. Among women, it is breast, lung, and colorectal.
For an American reader, the translation is straightforward. Global cancer cases rising by two-thirds does not mean US cases rise by two-thirds, and it does not mean your odds changed the week the report came out.
Why You Are Seeing 67%, 70%, and “Nearly Double”
No competitor explained this, and it is the reason so many readers walked away confused.
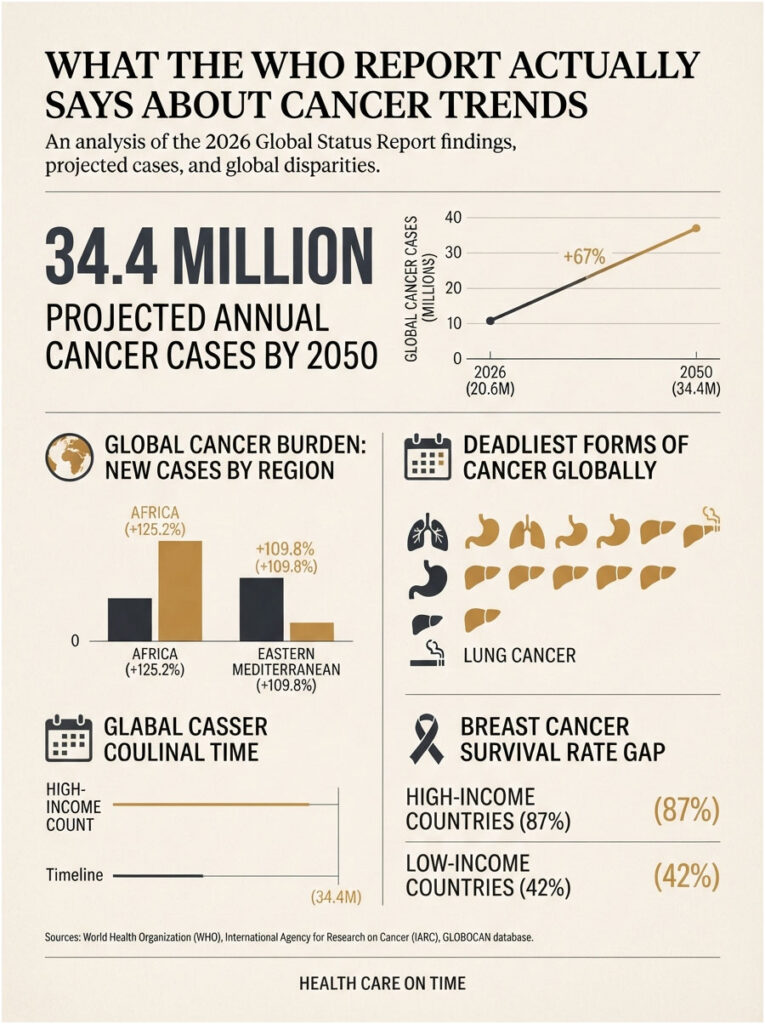
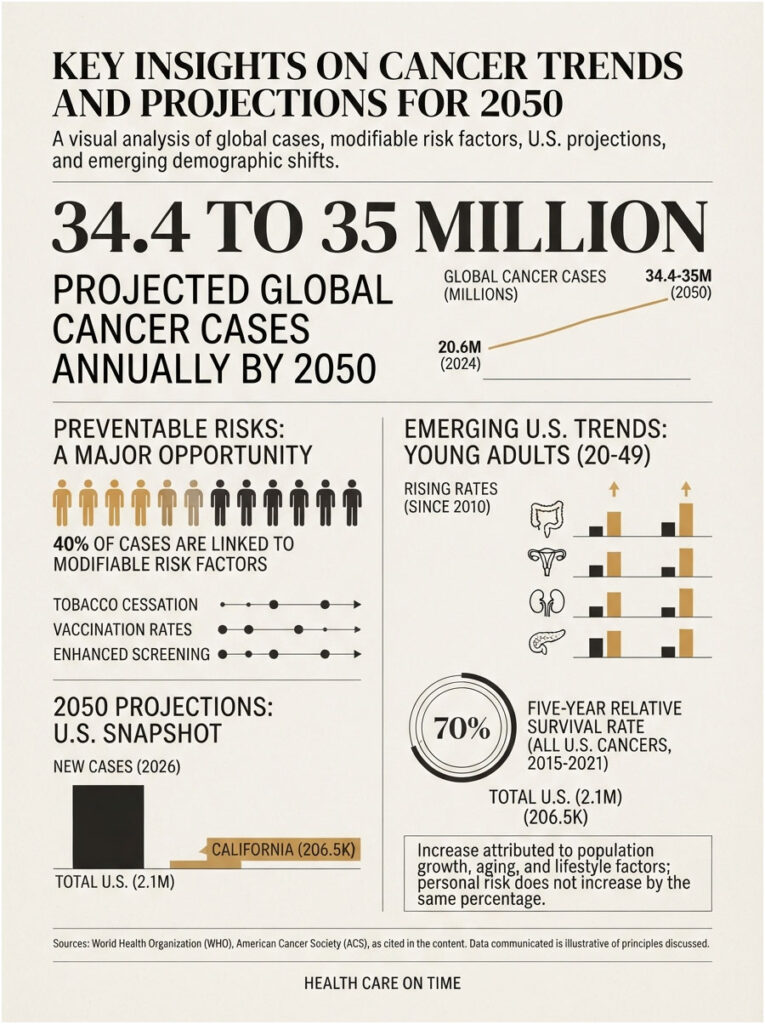
The precise GLOBOCAN projection is 34.4 million annual cases by 2050. Against the 20.6 million baseline, that is a 67% increase.
The WHO release rounds the projection to “nearly 35 million.” Divide 35 by 20.6 and you get 69.9%, which Forbes and others fairly reported as nearly a 70% increase.
“Nearly double” is the loosest phrasing. It describes a jump from roughly 20 million to roughly 35 million, a 1.7-fold rise. A genuine doubling would need about 41 million cases.
All three describe one calculation. None is wrong. They are different roundings of the same projection.
Where the Projection Comes From
The estimates come from IARC’s Global Cancer Observatory, which compiles incidence and mortality data covering 34 to 36 cancer types across 186 countries and territories.
That database, GLOBOCAN, is the closest thing the world has to a single cancer ledger. Its 2050 figure is a demographic projection, and that distinction matters more than any headline suggested.
Table 1: Global Cancer Burden, 2024 Baseline vs 2050 Projection
| Measure | 2024 Estimate | 2050 Projection | Change | Source Basis |
| New cases worldwide, per year | 20.6 million | 34.4 million | +67% | GLOBOCAN 2024, IARC |
| New cases, rounded figure in WHO release | 20.6 million | Nearly 35 million | Close to +70% | WHO Global Status Report on Cancer 2026 |
| Deaths worldwide, per year | Close to 10 million (about 26,000 daily) | Rising alongside incidence | Second leading cause of death globally | WHO, July 2026 |
| Case increase, African region | Baseline year | +125.2% | Steepest of any WHO region | WHO Global Status Report on Cancer 2026 |
| Case increase, Eastern Mediterranean region | Baseline year | +109.8% | Second steepest | WHO Global Status Report on Cancer 2026 |
| Cases linked to modifiable risk factors | Nearly 4 in 10 (roughly 8 million yearly) | Same share if exposure holds steady | 30 factors identified, 9 of them infections | IARC analysis, Nature Medicine |
| Countries with a national cancer control plan | 82% | Universal coverage is the stated goal | Up from 50% in 2010 | WHO Global Status Report on Cancer 2026 |
The Regional Picture Is Wildly Uneven
In 2024, Asia accounted for the largest share, with more than half of all cancer cases (50.7%) and deaths (56.5%), reflecting its large population. Europe carried a disproportionately high burden, contributing 21% of global cases and 20% of deaths despite having only about 9% of the world’s population. The biggest projected increases fall on the African and Eastern Mediterranean regions, at 125.2% and 109.8% respectively.
The survival gap is starker than the incidence gap. While 87% of women with breast cancer survive five years after diagnosis in high-income countries, only about 42% do so in low-income countries.
The Part Almost Every Headline Gets Wrong
Patients booking tests through HealthCareOnTime asked us the same question dozens of times in the weeks after this report landed. Does a 70% rise mean my odds of getting cancer went up 70%?
No. And the answer is not a technicality.
More Cases Does Not Mean Higher Personal Risk
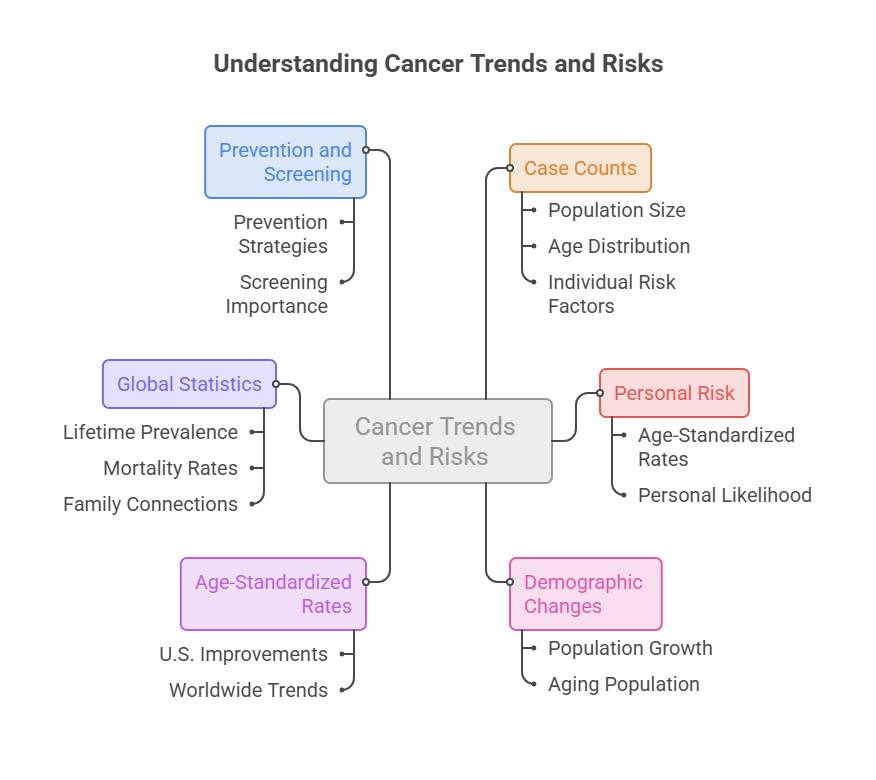
Cancer case counts are a product of three things: how many people exist, how old they are, and how likely each person is to develop cancer at a given age.
The 2050 projection moves almost entirely on the first two. The likely rise in cancer cases is driven primarily by demographics rather than a sudden increase in individual risk.
More people are alive. More of them reach the ages when cancer becomes common. Cancer is, in large part, a disease of accumulated cell divisions and accumulated time.
The Difference Between Crude Counts and Age-Standardized Rates
Epidemiologists separate these deliberately. A crude count tells you how many diagnoses a health system must handle. An age-standardized rate tells you whether the disease is actually becoming more likely for a person of a given age.
The 35 million figure is a crude count. It is the number hospitals, oncologists, and insurers need to plan for.
Your personal risk is better described by the age-standardized rate, and in the United States that measure has been moving in a favorable direction for most cancers over three decades.
Lifetime Risk in Plain Numbers
About 1 in 5 people worldwide will develop cancer during their lifetime, and 1 in 9 men and 1 in 13 women will die from the disease. WHO also reports that 92% of people globally will have a close family member or friend diagnosed with cancer.
That second number reframes the whole story. Cancer is not a rare event happening to other people. It is close to a universal experience, which is exactly why prevention and cancer screening carry so much weight.
What Would Actually Change Your Odds
Nothing in the WHO report suggests your biology changed in July 2026. What the report does say is that a large slice of the future burden is not fixed, and that slice is where an individual has real influence.
The Four-in-Ten Number
The most useful finding in the report is not the frightening one. Isabelle Soerjomataram of IARC noted that four in ten new cancer cases are linked to risk factors which are already understood, including tobacco use, infections, alcohol use, and excess body weight.
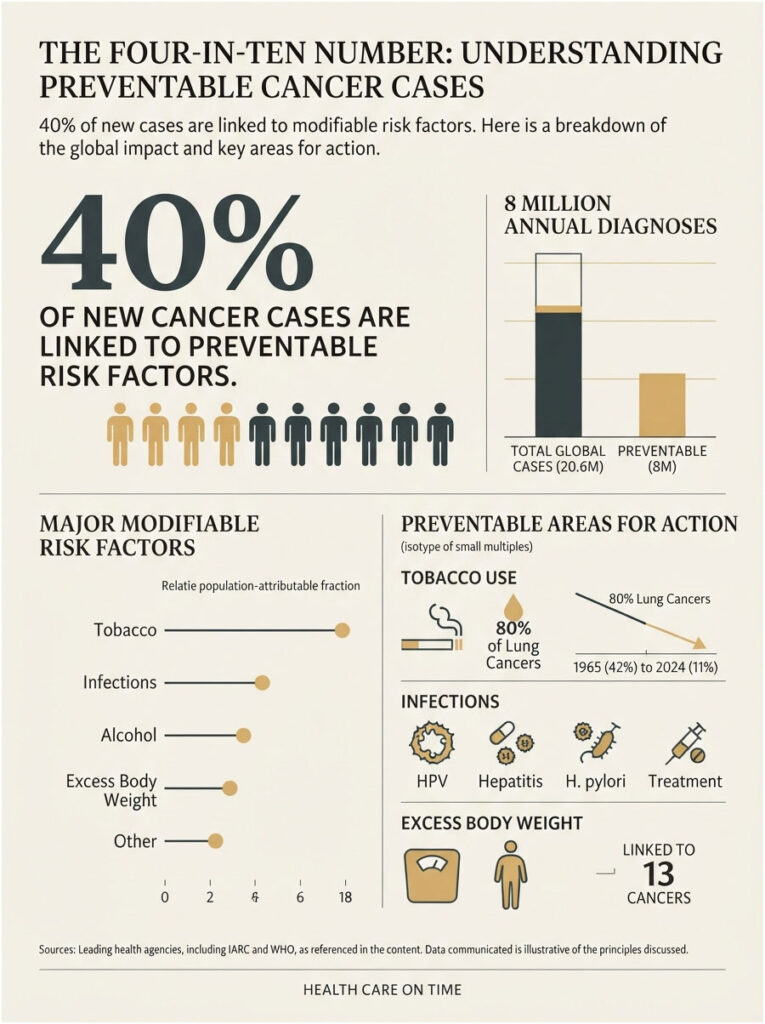
Applied to today’s 20.6 million global cancer cases, that is roughly 8 million diagnoses a year sitting in the potentially avoidable category.
Thirty Modifiable Risk Factors, Nine of Them Infections
The analysis published in Nature Medicine alongside the WHO report outlines 30 modifiable risk factors, including, for the first time, nine types of infections.
That infection breakdown is new at this level of detail, and it changes the practical advice, because infections are the one category with vaccines and inexpensive blood tests attached.
The Big Four for American Readers
Tobacco
Smoking prevalence among US adults has collapsed over two generations. It fell from 42% in 1965 to 11% in 2024.
The damage lags the behavior by decades, though. Over 80% of lung and laryngeal cancers and 50% of esophageal, oral and nasal cavity, and bladder cancers are still caused by smoking.
The global trend is improving too. Tobacco use has declined by 27% since 2010, contributing to reductions in lung cancer cases and deaths in some regions.
Excess Body Weight
IARC has linked obesity to 13 separate cancers, including breast, colorectal, kidney, endometrial, thyroid, pancreatic, liver, multiple myeloma, gastric cardia, meningioma, ovarian, esophageal, and gallbladder.
IARC Director Dr. Elisabete Weiderpass put it directly: the cancer profile is evolving, increasingly driven by rising rates of obesity, physical inactivity, unhealthy diets, and air pollution.
In cases reviewed across our diagnostic network, metabolic markers are the ones most often flagged as abnormal years before anything else appears.
Alcohol
Alcohol sits in the WHO risk list alongside tobacco, and it is the factor Americans most consistently underestimate. No major agency has established a cancer-protective drinking level.
The cancers most tied to alcohol include breast, colorectal, liver, esophageal, and head and neck.
Infections
Nearly four in ten cancer cases globally are linked to preventable risk factors, particularly infections such as human papillomavirus (HPV), hepatitis B and C, and helicobacter pylori, alcohol, tobacco use, high body mass index and insufficient physical activity.
This is the most actionable group on the list. HPV has a vaccine. Hepatitis B has a vaccine. Hepatitis C has a cure. H. pylori has a simple test and a two-week antibiotic course.
Our lab partners report that hepatitis panel volumes stay well below what the eligible US population would suggest, which is a gap with a direct cancer consequence downstream.
What “Preventable” Honestly Means
This word gets misused, and misusing it hurts patients.
“Four in ten preventable” is a population-attributable fraction. It means that if an entire population eliminated those exposures, roughly 40% of cases would not occur. It does not mean any individual with those exposures will get cancer, and it certainly does not mean anyone without them is safe.
Plenty of people who never smoked, never drank, exercise daily, and carry a healthy weight still receive a diagnosis. Genetics, random cell-division errors, and environmental exposures outside personal control all contribute.
Our medical team’s position is that risk reduction is worth doing precisely because it shifts probability, not because it delivers a guarantee.
What the 2050 Forecast Means for Americans
The global story is real, but it is not the story a reader in Ohio or Arizona lives in. The American picture has its own numbers, and they run in two directions at once.
The US Numbers Right Now
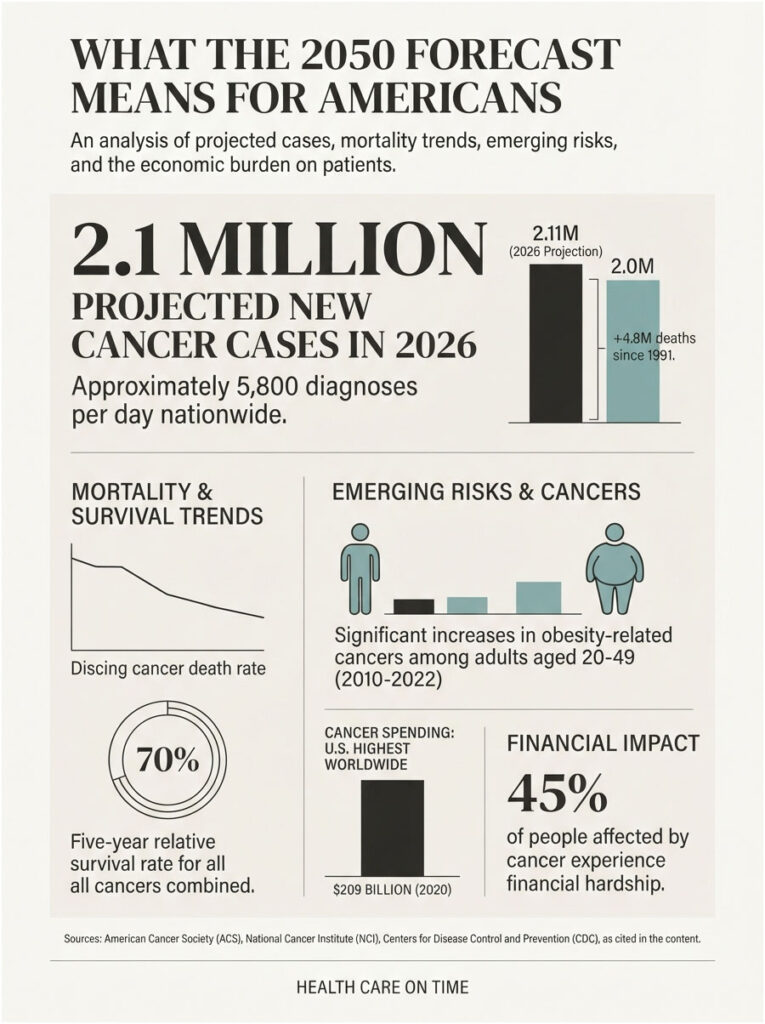
In 2026, approximately 2,114,850 new cancer cases and 626,140 cancer deaths are projected to occur in the United States. That works out to roughly 5,800 new diagnoses every single day. By state, California leads with approximately 206,500 new diagnoses projected for 2026.
The US Is Moving Better Than the Global Average
Here is the counterweight the alarming coverage skipped.
The cancer mortality rate continued to decline through 2023, averting 4.8 million deaths since 1991, largely because of smoking reductions, earlier detection, and improved treatment. For the first time, the five-year relative survival rate for all cancers combined reached 70% for people diagnosed during 2015-2021 in the United States.
The gains are largest where they were once nonexistent. Survival improved for myeloma from 32% to 62%, and for liver cancer from 7% to 22%, with lung cancer climbing from a 15% baseline. Rebecca Siegel of the American Cancer Society summarized it as seven in ten people now surviving cancer five years or more, up from only half in the mid-1970s.
The Warning Sign Inside the Good News
One trend runs against the improvement, and it should concern anyone under 50.
Research presented by Meredith Shiels of the National Cancer Institute showed significant increases in four obesity-related cancers, colorectal, uterine, kidney, and pancreatic, among US adults aged 20 to 49 from 2010 to 2022. Colorectal cancer is now the second most common cause of cancer death overall in the United States and the leading cancer death in people under age 50. In counties with the highest obesity prevalence, the risk of developing those four cancers ran measurably higher between 2018 and 2022.
Earlier American Cancer Society work found the same pattern in birth cohorts. The risk of colorectal, uterine, pancreatic, and gallbladder cancers in millennials runs at about double the rate baby boomers had at the same age. As Ahmedin Jemal of the American Cancer Society framed it, cancer trends in young adults often serve as a sentinel for the future disease burden in older adults, among whom most cancer occurs.
Early-onset cancer is the one variable that could pull the US away from its favorable trend line, which is why the screening ages in the next section moved down rather than up.
Cost and Access
The WHO report found the United States has the highest cancer spending worldwide, at nearly $209 billion in 2020, with costs expected to rise as more novel treatments are adopted into standard protocols.
Cost is not only a system problem. WHO’s first survey of people affected by cancer found that at least 45% experience financial hardship, more than half report mental health challenges, and nearly all caregivers report strain.
Table 2: US Cancer Snapshot, Latest Verified Figures
| Metric | Current Figure | Direction of Travel | Source |
| New cancer cases projected, 2026 | 2,114,850 (about 5,800 per day) | Rising with population size and age | American Cancer Society, Cancer Statistics 2026 |
| Cancer deaths projected, 2026 | 626,140 | Death rate falling even as counts rise | American Cancer Society, Cancer Statistics 2026 |
| Five-year relative survival, all cancers | 70% (2015-2021 diagnoses) | Up from about 50% in the mid-1970s | CA: A Cancer Journal for Clinicians, Jan 2026 |
| Cumulative deaths averted since 1991 | 4.8 million | Continuing to accumulate | American Cancer Society, Cancer Statistics 2026 |
| Adult cigarette smoking prevalence | 11% (2024) | Down from 42% in 1965 | ACS Cancer Facts & Figures 2026 |
| Early-onset obesity-related cancers, ages 20-49 | 4 cancer types rising, 2010-2022 | Increasing, the one adverse US trend | National Cancer Institute, presented at AACR |
| Annual US cancer spending | Nearly $209 billion (2020) | Rising, highest of any country | WHO Global Status Report on Cancer 2026 |
| Diet and activity guideline adherence | 10% to 20% lower diagnosis risk, 24% to 30% lower death risk | Stable finding across studies | ACS Cancer Facts & Figures 2026 |
Cancer Screening Is the Lever Americans Actually Control
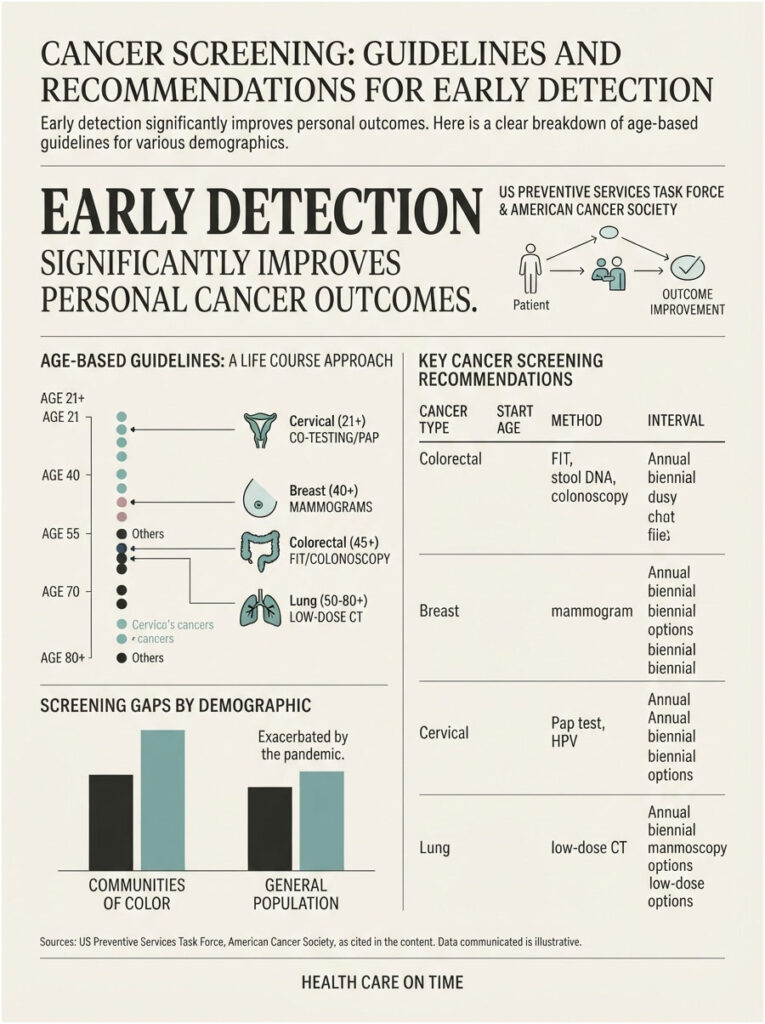
Nothing an individual does will move a global projection. Early detection moves personal outcomes more than any other single variable, and the United States already has clear age-based guidance.
Across the patients we serve, the most common reason for a late-stage diagnosis is not a missing test. It is a test that existed, was covered by insurance, and never got booked.
What Current US Guidelines Say
The two main bodies, the US Preventive Services Task Force and the American Cancer Society, agree on most starting ages and differ on a few intervals. Both positions appear here rather than blended into one.
Colorectal cancer. The USPSTF recommends offering colorectal cancer screening starting at age 45 years, continuing through 75, with selective screening for adults aged 76 to 85 based on overall health, prior screening history, and preference. Options include annual FIT, stool DNA testing every one to three years, or colonoscopy every ten years.
Breast cancer. The USPSTF recommends that all women get screened every other year starting at age 40 and continuing through age 74. The American Cancer Society position allows screening to begin at 40, recommends annual mammograms from 45, and permits a shift to every two years from 55.
Cervical cancer. The USPSTF recommends cervical cytology every three years for women aged 21 to 65, or cytology plus high-risk HPV co-testing every five years for women aged 30 to 65.
Lung cancer. Low-dose CT screening is recommended for adults aged 50 to 80 with a significant smoking history of 20 or more pack-years.
Prostate cancer. No blanket recommendation exists. Shared decision-making between patient and clinician is the standard approach.
Where Family History Changes the Timeline
Average-risk guidance does not apply to everyone, and this is where people most often get the timing wrong.
Individuals with a first-degree relative diagnosed with colorectal cancer before age 60 should begin screening at age 40, or ten years before the relative’s diagnosis age, whichever comes first. Women with a family history of breast, ovarian, tubal, or peritoneal cancer should be assessed for BRCA1 and BRCA2 mutations.
The Screening Gap
Cancer screening uptake since the pandemic has been slower among communities of color, which may worsen existing disparities in survival and mortality.
Globally the picture is worse. Fewer than one in three countries currently include cancer care in their universal health coverage packages.
Table 3: If This Describes You, Here Is Your Next Step
| If This Describes You | Recommended Action | Typical Starting Age | Why It Matters |
| Woman turning 40, average risk | Book a mammogram, repeat every 2 years | 40 (USPSTF), 40 to 45 (ACS) | USPSTF lowered the age from 50 to 40 in its 2024 update |
| Any adult turning 45, average risk | Choose colonoscopy, annual FIT, or stool DNA testing | 45 | Screening age dropped from 50 in 2021 as young-onset cases rose |
| Current or former smoker, 50 to 80, 20+ pack-years | Request an annual low-dose CT scan | 50 | Over 80% of lung cancers trace to smoking, and stage at detection drives survival |
| Woman aged 21 to 29 | Pap test every 3 years | 21 | Cervical cancer is highly preventable when precancerous change is caught |
| Woman aged 30 to 65 | Pap every 3 years, hrHPV every 5 years, or co-testing every 5 years | 30 | HPV testing safely extends the interval between screens |
| First-degree relative with colorectal cancer before 60 | Start colorectal screening early, do not wait for 45 | 40, or 10 years before the relative’s diagnosis | Family history raises risk well before the average-risk threshold |
| BMI in the obese range, under age 50 | Discuss colorectal, kidney, uterine, and pancreatic risk with your physician | Now, regardless of age | Four obesity-linked cancers rose among US adults aged 20 to 49 from 2010 to 2022 |
| Known chronic hepatitis B or hepatitis C | Confirm treatment status and ask about liver cancer surveillance | At diagnosis | Hepatitis B and C sit among the nine infections IARC identified as modifiable |
Where This Projection Could Be Wrong
Good health reporting says what a number cannot do. This one has real limits.
What the Model Assumes
The 2050 figure is a demographic projection built on the assumption that risk factor prevalence stays roughly where it is today. The 67% increase is driven solely by population aging and growth, and it does not prove that cancer risk itself is rising.
That makes it a description of the present carried forward, not a forecast of what will happen. If exposures change, the number changes.
Three Things That Could Bend the Curve Down
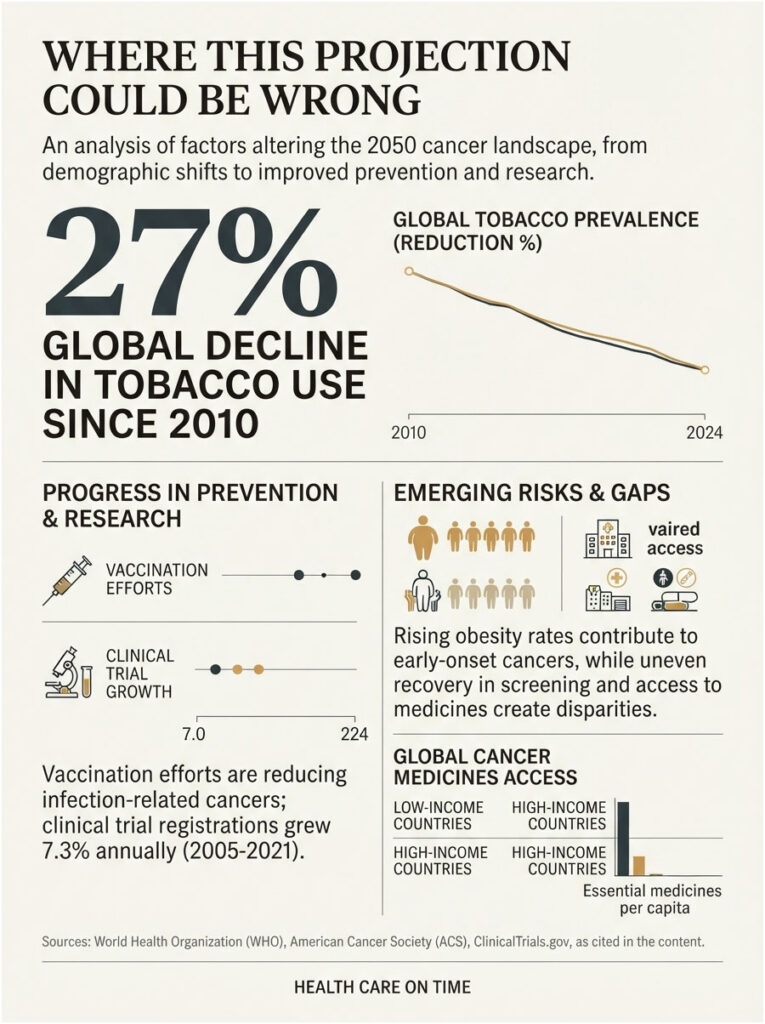
Vaccination is the clearest. Infection-related cancers are already decreasing thanks to expanding vaccination coverage and improved water, sanitation and hygiene.
Tobacco decline is second. A 27% global drop since 2010 has not yet fully surfaced in incidence data, because lung cancer follows exposure by decades.
Research pace is third. Registered clinical trials increased at an annual rate of 7.3% between 2005 and 2021. Political commitment has strengthened as well, with 82% of countries now having national cancer control plans, up from 50% in 2010.
Three Things That Could Make It Worse
The obesity trajectory tops the list, and the early-onset cancer data suggests that effect is already arriving.
Access is second. Availability of the top 20 priority cancer medicines ranges from just 9% to 54% in low- and lower-middle-income countries, compared with 68% to 94% in high-income countries.
Screening drift is third. Cancer screening only works when people actually take the tests, and post-pandemic recovery has been uneven across US communities.
Dr. Tedros Adhanom Ghebreyesus framed the inequity plainly: whether a person survives cancer should never depend on where they were born or what they earn.
What to Do With This Information
A projection about 2050 is not an instruction. Here is what turns it into something usable this month.
- Know your cancer screening ages and book them. Write down the rows in Table 3 that apply to you, then put the earliest one on a calendar with a date attached.
- Map your family history before your next physical. First-degree relatives, cancer type, age at diagnosis. That single page changes what your doctor recommends.
- Handle the four factors carrying the most weight. Tobacco, alcohol, body weight, physical activity. Adults who closely follow the ACS diet and physical activity guideline are roughly 10% to 20% less likely to be diagnosed with cancer and 24% to 30% less likely to die from it.
- Take the vaccines that exist. HPV and hepatitis B prevent cancers, not just infections.
- Know your baseline lab values. A single normal panel matters mainly as a comparison point for the next one.
- Treat a persistent symptom as a reason to test, not a reason to wait. Unexplained bleeding, a new lump, a cough outlasting three weeks, unintended weight loss, or a change in bowel habit all warrant a same-month appointment.
Patients often ask us whether a full-body scan is a shortcut around all of this. It is not. No major US body recommends whole-body imaging for average-risk adults, because false positives lead to invasive follow-up procedures that carry real complication rates.
Frequently Asked Questions
How many cancer cases will there be in 2050?
WHO and IARC project roughly 34.4 to 35 million new cancer cases per year globally by 2050, up from 20.6 million in 2024. That is a 67% to 70% increase depending on which figure is used. The projection assumes current risk factor levels hold steady while populations grow and age.
Is the WHO saying cancer will double by 2050?
Not quite. The rise from about 20.6 million to about 35 million annual cases is roughly a 1.7-fold increase, which several outlets rounded up to “nearly double.” A true doubling would require around 41 million cases. The accurate framing is a two-thirds increase in global cancer cases.
Why do some reports say 67% and others say 70%?
Both use the same projection with different rounding. The precise GLOBOCAN estimate of 34.4 million against a 20.6 million baseline gives 67%. The WHO release rounds the projection to “nearly 35 million,” which works out to 69.9%, reported as nearly 70%.
Does a 70% rise mean my personal cancer risk went up 70%?
No. The projection counts total diagnoses, which scale with how many people exist and how old they are. Individual risk at a given age is measured by age-standardized rates, and in the United States those rates have been improving for most cancers over three decades.
What is driving the increase in cancer cases worldwide?
Population growth and aging account for the bulk of it. Cancer becomes far more common with age, so a larger, older world population produces more diagnoses even with unchanged per-person risk. Rising obesity, physical inactivity, poor diet, and air pollution add to the trend.
What percentage of cancer is preventable?
Nearly four in ten cases globally link to modifiable risk factors, roughly 8 million diagnoses per year. IARC identified 30 such factors, including nine infections. Preventable here means population-level attributable risk, not a guarantee that any individual person avoids cancer.
How many new cancer cases happen in the US each year?
The American Cancer Society projects 2,114,850 new cancer cases and 626,140 cancer deaths in the United States in 2026, averaging roughly 5,800 new diagnoses every day. California accounts for the largest state share at approximately 206,500 projected cases.
Are cancer rates rising in young adults in America?
Yes, for specific cancers. Colorectal, uterine, kidney, and pancreatic cancers all rose among Americans aged 20 to 49 between 2010 and 2022. Early-onset cancer is now serious enough that colorectal cancer is the leading cancer death in Americans under 50, which prompted the screening age drop to 45.
Which cancers are increasing the fastest?
Globally, the obesity-linked group grows fastest, including colorectal, uterine, kidney, and pancreatic cancers, particularly in younger age brackets. Lung cancer stays the deadliest overall worldwide. Infection-related cancers are one of the few categories actually declining, thanks to vaccination programs.
Is cancer survival in the United States improving?
Substantially. Five-year relative survival for all cancers combined reached 70% for people diagnosed between 2015 and 2021, up from about 50% in the mid-1970s. Cancer mortality rates have fallen steadily since 1991, averting an estimated 4.8 million deaths.
At what age should I start cancer screening?
For average-risk US adults: mammography from age 40, colorectal screening from 45, cervical screening from 21, and low-dose CT lung screening from 50 for those with a 20 pack-year smoking history. Family history can move any of these earlier.
Can anything actually change the 2050 projection?
Yes. The projection assumes risk factor exposure stays flat. Wider HPV and hepatitis B vaccination, continued tobacco decline, better cancer screening participation, and reversing obesity trends would all lower the final number. Access to treatment determines how many of those cases become deaths.
Frequently Asked Questions
Medical Disclaimer: This article is for general educational purposes and reflects published data from WHO, IARC, the American Cancer Society, and the US Preventive Services Task Force as of publication. It is not a substitute for professional medical advice, diagnosis, or treatment. Screening recommendations vary based on personal and family history. Always consult a licensed physician before making decisions about testing or care.
References
- WHO calls for urgent action as new cancer cases are projected to nearly double by 2050, World Health Organization
- Global Status Report on Cancer 2026, World Health Organization
- Global Cancer Observatory, International Agency for Research on Cancer
- Global cancer statistics 2024: GLOBOCAN estimates of incidence and mortality worldwide, CA: A Cancer Journal for Clinicians
- Cancer Statistics 2026, Siegel et al., CA: A Cancer Journal for Clinicians
- Cancer Facts & Figures 2026, American Cancer Society
- Annual Cancer Statistics Report 2026, American Cancer Society Pressroom
- Colorectal Cancer Screening Recommendation, US Preventive Services Task Force
- Breast Cancer Screening Recommendation, US Preventive Services Task Force
- What’s Behind the Increase in Cancer Cases Among Younger Adults, American Association for Cancer Research
- Four in ten global cancer cases preventable, Medical News Today coverage of the Nature Medicine analysis
- Cancer Fact Sheet, World Health Organization