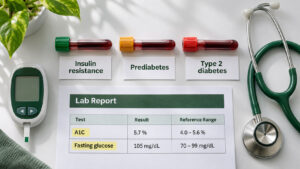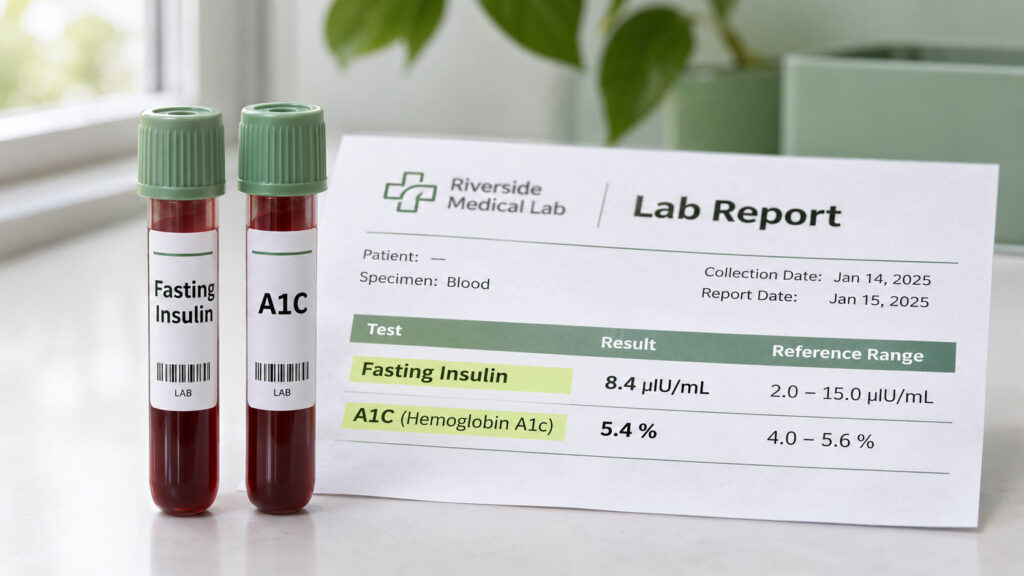
A fasting insulin test measures how much insulin your pancreas is releasing after an overnight fast, while an A1C shows your average blood sugar over roughly the past three months. Because the pancreas can push insulin higher for years to keep blood sugar in range, the two results can tell very different stories on the same day.
Table of Contents
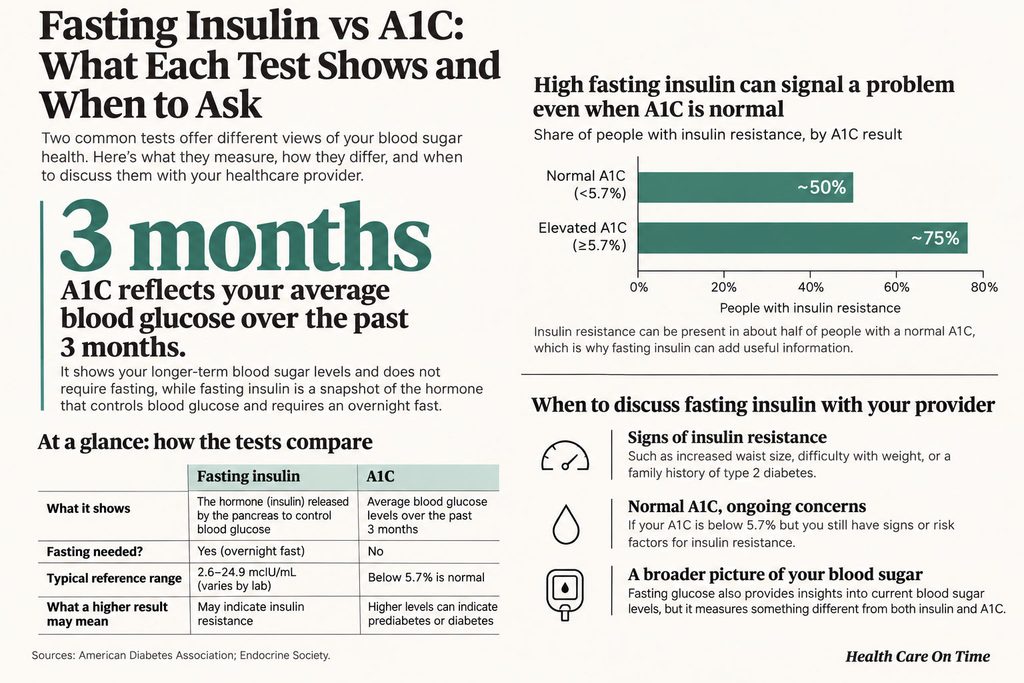
Quick Answer: In a fasting insulin vs A1C comparison, fasting insulin is a one-time reading of the hormone that clears sugar from your blood, taken after 8 to 12 hours without food. A1C reflects average blood glucose over about 3 months and is a standard test for diagnosing prediabetes and diabetes. A high fasting insulin with a normal A1C usually points to early insulin resistance, but insulin results vary by lab, so doctors rarely use it for screening.
What Each Test Actually Measures
Both tests start with an ordinary blood draw, and both often sit on a lab report under the same blood sugar heading. One looks at the hormone and the other at the sugar it controls, and they cover very different stretches of time, so one can be normal while the other is not.
Fasting insulin
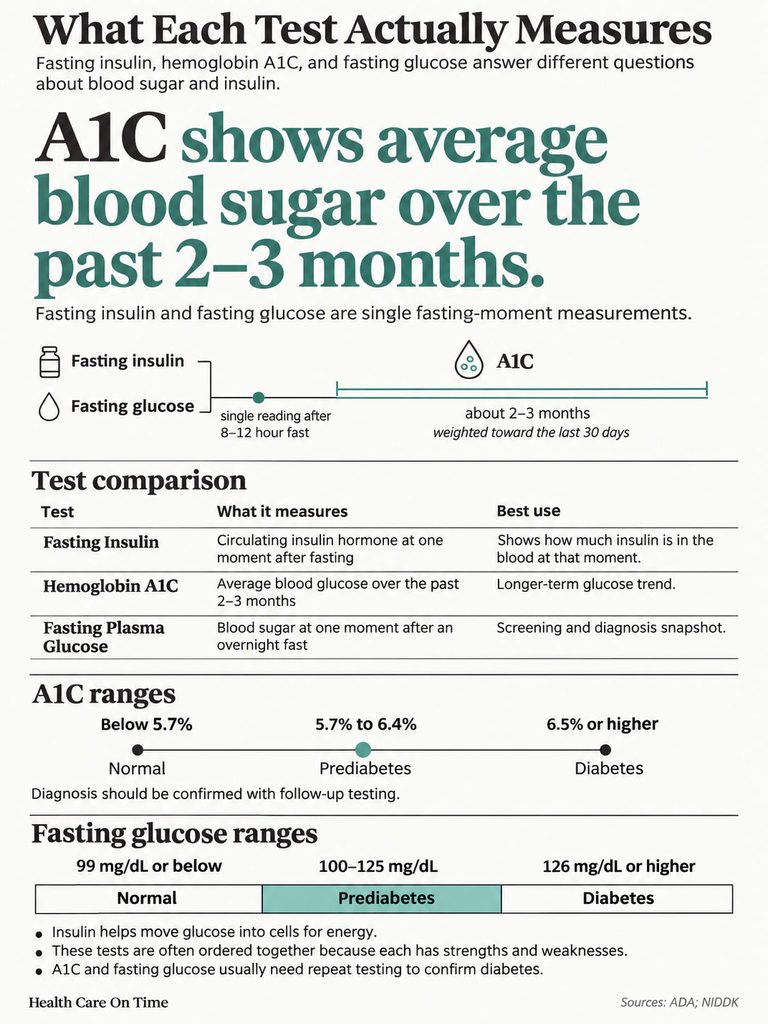
Insulin is the hormone your pancreas releases so glucose can move out of the blood and into muscle, fat and liver cells, where it’s used for energy. A fasting insulin test measures how much of that hormone is circulating at one moment. You’ll usually skip food and drinks other than water for 8 to 12 hours first, because insulin rises and falls with blood glucose all day long, and a fasting sample gives a baseline that breakfast can’t distort.
In routine care the insulin test has a fairly small set of jobs: tracking down the cause of low blood sugar, checking for an insulinoma (a usually benign pancreatic tumor that makes too much insulin) and following people who’ve had an islet cell transplant for type 1 diabetes. Diabetes itself is diagnosed with glucose-based tests.
Results are reported in microunits per milliliter (mcIU/mL, sometimes written µIU/mL). The reference range at Mayo Clinic Laboratories runs from 2.6 to 24.9 mcIU/mL, and in type 2 diabetes insulin tends to be normal or elevated early on, then falls in the late stage. Your own lab may print a different range.
Hemoglobin A1C
A1C, also written HbA1c, comes at blood sugar from a different direction. Glucose in the blood attaches to hemoglobin, the oxygen-carrying protein inside red blood cells, and the more glucose there is, the more hemoglobin gets coated. Red blood cells live for a few months, so the share of coated hemoglobin works as a running average.
That average covers about the past 3 months, with the most recent 30 days weighing more heavily than the months before. Results come back as a percentage: below 5.7% is normal, 5.7% to 6.4% is prediabetes, and 6.5% or higher is diabetes. A single high result usually gets repeated before anyone makes a diagnosis, unless you already have clear diabetes symptoms. The cutoffs were set where the long-term damage to eyes, kidneys, nerves and heart from an A1C that’s too high starts to become likely.
Because the last month counts most, A1C lags behind real change. If you started walking every day and cut back on sugary drinks six weeks ago, your next A1C will show only part of that effect.
Where fasting glucose fits
Fasting plasma glucose sits between the two: a single reading after an overnight fast, like insulin, but of sugar itself, like A1C. A result of 99 mg/dL or below is normal, 100 to 125 mg/dL is prediabetes and 126 mg/dL or higher is diabetes on the CDC’s testing scale. Fasting glucose and the glucose tolerance test both call for an overnight fast; A1C doesn’t.
Since all three often appear on one requisition, here’s how they differ.
| Feature | Fasting insulin | Hemoglobin A1C | Fasting plasma glucose |
| What it measures | Insulin hormone in the blood | Share of hemoglobin coated with glucose | Glucose (sugar) in the blood |
| Time window | One moment, after fasting | About 3 months, last 30 days weigh most | One moment, after fasting |
| Units | mcIU/mL (µIU/mL) | Percent (%) | mg/dL (mmol/L) |
| Typical reference | 2.6–24.9 mcIU/mL at Mayo Clinic Laboratories; ranges differ by lab | Below 5.7% normal; 5.7–6.4% prediabetes; 6.5% or higher diabetes | 99 mg/dL or below normal; 100–125 prediabetes; 126 or higher diabetes |
| Fasting needed | Yes, 8–12 hours; stop biotin first | Not listed by CDC | Yes, overnight |
| Used to diagnose diabetes | No | Yes, confirmed with a repeat test | Yes, confirmed with a repeat test |
| Main weakness | No standard cutoff; results differ between lab methods | Skewed by anemia, blood loss, kidney disease and some hemoglobin variants | Single reading; can miss high after-meal sugar |
Why Insulin Can Run High While A1C Still Looks Normal
Insulin resistance means muscle, fat and liver cells stop responding to insulin the way they should. The pancreas usually answers by making more of it, and for a long stretch, often years, that extra insulin is enough to push glucose into cells anyway. Blood sugar stays in the normal range and A1C stays below 5.7%.
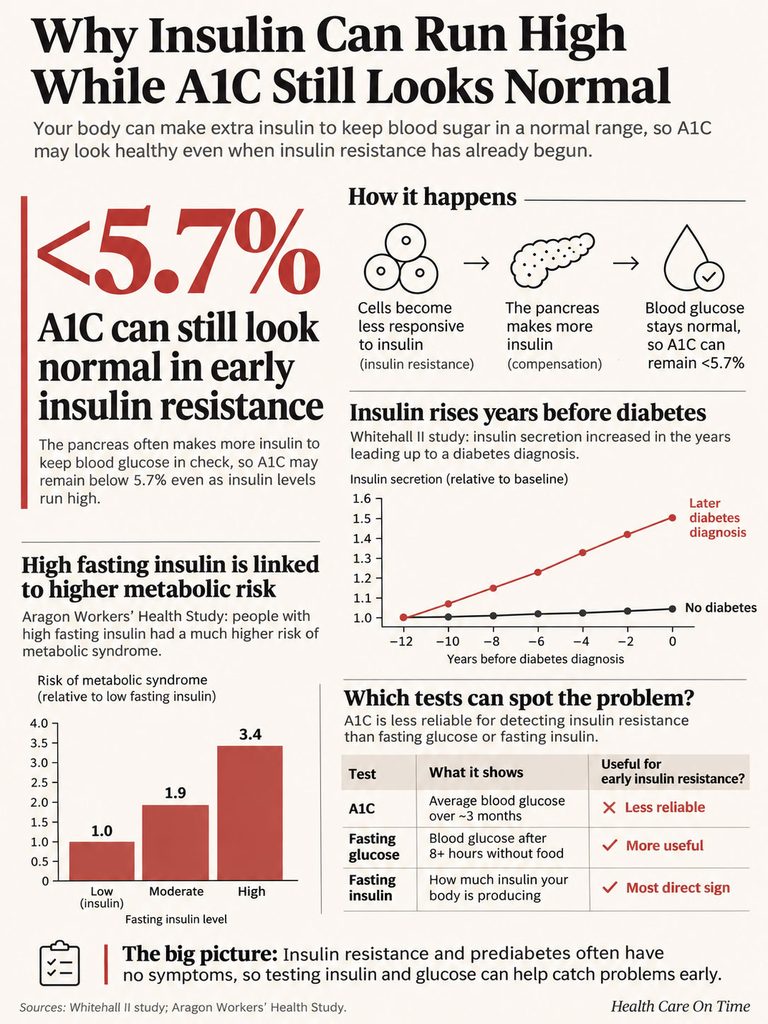
During that stretch the change is in how hard the pancreas is working, which a fasting insulin test can see and a glucose test can’t. High insulin alongside normal or slightly high glucose is the classic sign of insulin resistance. Eventually the pancreas may stop keeping up, glucose climbs, and prediabetes appears.
None of this usually comes with symptoms. Insulin resistance and prediabetes tend to be silent, and they’re picked up, if at all, through blood work or through problems that travel with them: high blood pressure, fatty liver disease, high triglycerides or unhealthy cholesterol, and extra weight around the middle.
Long-term data from British civil servants in the Whitehall II cohort, followed from 1991 to 2013, give a rough timeline. Among the 987 people who developed diabetes, a 2017 analysis found that a model-based measure of insulin secretion (HOMA2-B) had kept rising until about 7 years before diagnosis in both South Asian and white participants, then fell, while their glucose curves didn’t clearly separate from everyone else’s until roughly 6 years before diagnosis. A1C tracks glucose, so through those years it would have looked normal.
Picture a woman in her 30s with PCOS whose yearly A1C and fasting glucose have always come back fine. She may well be in that compensating stretch, and a fasting insulin drawn the same morning could be the only number that shows it. Her A1C is measuring sugar correctly, and her sugar really is normal for now; it just can’t show the extra insulin holding it there.
In the Aragon Workers’ Health Study, 3,200 Spanish working men without diabetes were sorted into thirds for each measurement. Men in the top third for A1C had 2.68 times the odds of metabolic syndrome (a cluster that includes waist size, blood pressure, triglycerides, HDL cholesterol and glucose) compared with the bottom third, while men in the top third for fasting insulin had 11.36 times the odds, and even in men without the syndrome, small rises in insulin went along with risk factors starting to cluster. The design limits what it can prove. Only men took part, everything was measured at one point in time so cause and effect can’t be sorted out, and none of it shows that testing insulin improves anyone’s health. Data from the Insulin Resistance Atherosclerosis Study (IRAS), summarized in a Diabetes Care review, found A1C was more loosely tied to insulin resistance and insulin secretion than fasting glucose or the 2-hour glucose tolerance test were. The two studies used very different groups and methods, and they still landed on the same weakness.
How Often A1C and Glucose Tests Miss the Problem
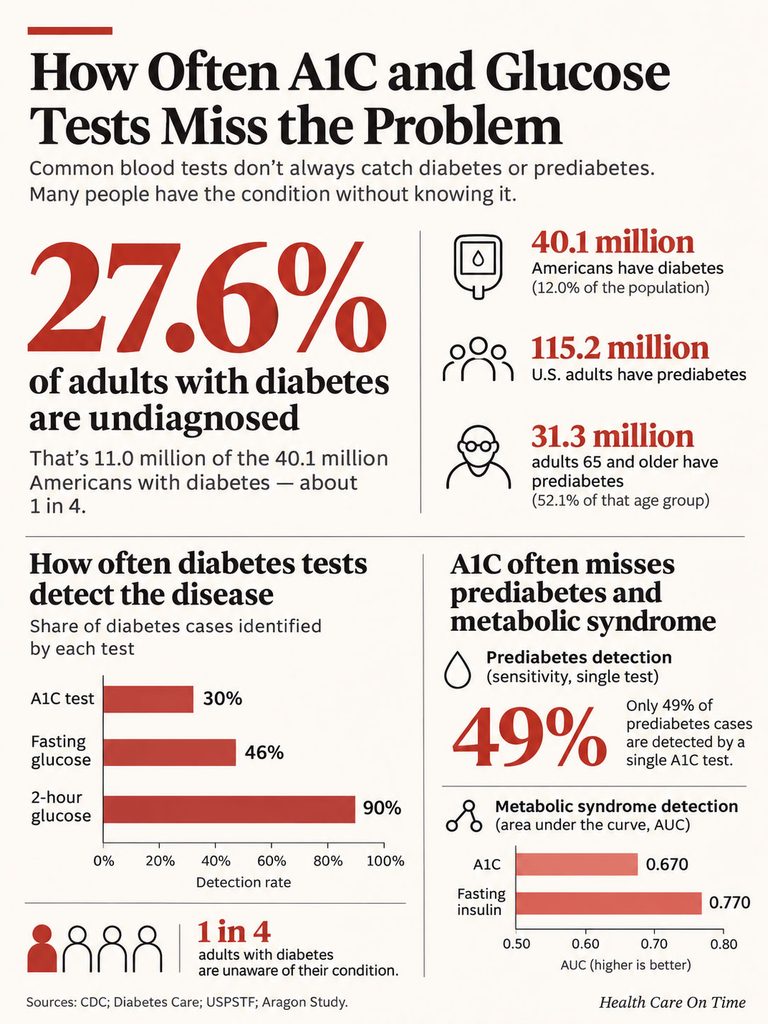
Federal survey data put the scale of the problem, and the size of the blind spot, into numbers.
| Measure | Figure | Source |
| Americans with diabetes (diagnosed or not), 2023 | 40.1 million, 12.0% of the population | CDC National Diabetes Statistics Report |
| Adults with diabetes who are undiagnosed | 27.6% (11.0 million people) | CDC National Diabetes Statistics Report |
| US adults with prediabetes | 115.2 million | CDC National Diabetes Statistics Report |
| Adults 65 and older with prediabetes | 31.3 million (52.1% of that age group) | CDC National Diabetes Statistics Report |
| Share of diabetes cases found by each test, NHANES 2003–2006 | A1C 6.5% or higher: 30%; fasting glucose 126 or higher: 46%; 2-hour glucose 200 or higher: 90% | Diabetes Care review, 2011 |
| How often a single A1C catches prediabetes | Sensitivity 49%, specificity 79% | USPSTF evidence, reported by AAFP |
| How well each test flags metabolic syndrome (area under the curve, 1.0 = perfect) | A1C 0.670; fasting insulin 0.770 | Aragon Workers’ Health Study, 2015 |
The NHANES numbers come from people who had all three tests at the same visit, and A1C found fewer cases than either glucose test, which helps explain why US screening guidelines accept any of the three. Roughly 1 in 4 adults with diabetes doesn’t know it, and more than half of Americans 65 and older have prediabetes, even though most of them have had blood work at some point.
A sensitivity of 49% for prediabetes means a single A1C catches about half of the people who actually have it; the other half walk out with a normal result.
The Limits of Each Test
Fasting insulin reacts early but is hard to standardize. A1C is convenient and has agreed cutoffs, but it can be thrown off by anything that changes your red blood cells.
Why a fasting insulin number is hard to read
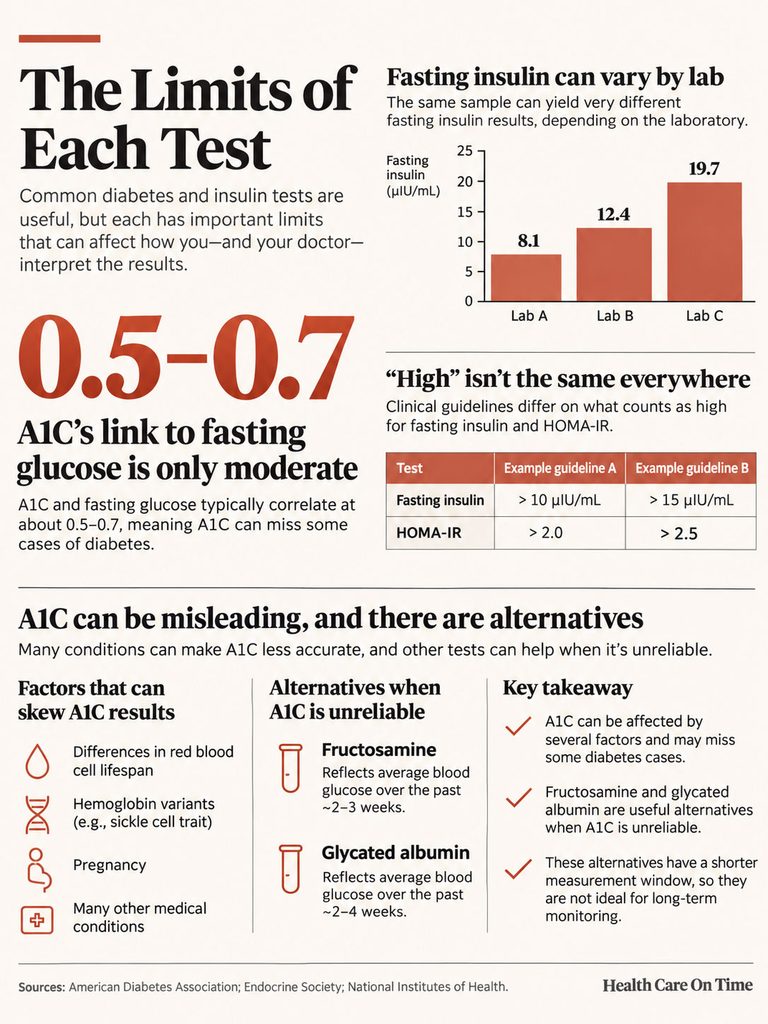
Labs don’t all measure insulin the same way, and the differences are large. In a 2009 Clinical Chemistry report, an insulin standardization work group described sending the same 39 blood samples to 10 commercial methods from 9 manufacturers and checked each one against a mass spectrometry reference, only 4 of the 10 had at least 95% of results within 32% of the reference value. Seven of the 10 were off by more than 15.5% in anywhere from 36% to 100% of samples.
So a fasting insulin of 14 at one lab and 18 at another might reflect the lab’s method rather than any change in you. A range printed on one report doesn’t carry over to another, and no single national cutoff for “high” fasting insulin exists the way it does for A1C.
Other things can shift the result too:
- Biotin, a common hair-and-nail supplement, can interfere with the assay. Stop it for at least a day beforehand; Mayo Clinic Laboratories asks for 12 hours without it.
- People who inject insulin can develop anti-insulin antibodies that throw off the measurement, and the Mayo test doesn’t recognize most insulin analogues at all, so an insulin level on someone using insulin needs a specialist’s eye.
- A sample drawn before the fast is long enough reads higher, since insulin rises after food.
- Hemolysis, red cells breaking down in the tube after the draw, releases enzymes that degrade insulin and can make the reading falsely low.
HOMA-IR combines fasting insulin and fasting glucose into one estimate of insulin resistance. The authors who introduced it in Diabetologia in 1985 found that it tracked closely with the gold-standard clamp test (correlation 0.88) and also that it was imprecise, a coefficient of variation of about 31% for the insulin resistance estimate. That’s enough to follow a trend across several tests and not enough to read meaning into a single decimal point. Clinics also disagree on where “high” begins, and no HOMA-IR cutoff is official, which is one reason the numbers that separate insulin resistance from diabetes are mostly glucose numbers.
When A1C gives the wrong picture
A1C assumes your red blood cells live a normal lifespan and that your hemoglobin is the common type. When either assumption fails, the number drifts. A1C can be less accurate after:
- recent blood loss or a transfusion
- sickle cell disease, hemodialysis or erythropoietin treatment (a drug that boosts red cell production)
- very low iron, as in iron-deficiency anemia, which can falsely raise it
- kidney failure or liver disease
- an inherited hemoglobin variant, more common in people of African, Mediterranean or Southeast Asian descent
About 1 in 13 African Americans carries sickle cell trait, and depending on the lab method, a variant can push A1C falsely high or falsely low. If you carry the trait, or sickle cell disease or thalassemia runs in your family, ask whether the lab’s A1C method is affected. Pregnancy, smoking, infections, hemolysis and uremia (waste building up in the blood from kidney failure) change red cell turnover as well, and the relationship between A1C and actual blood glucose differs somewhat between ethnic groups. A fingerstick A1C done in a doctor’s office shouldn’t be used to diagnose diabetes at all; diagnosis needs a lab sample.
Even with healthy red cells, A1C and fasting glucose don’t line up perfectly. The correlation between them is about 0.85, which leaves as much as 30% of the variation in fasting glucose unexplained by A1C. In the Finnish Diabetes Prevention Study, an A1C cutoff of 6.5% picked up only 39% of new diabetes cases, and the Diabetes Care authors estimated that relying on A1C alone would delay the diagnosis in about 60% of people developing diabetes. Those figures come from the side of a published debate arguing against A1C, so read them as the strongest case against it. Still, they explain why a doctor may add a glucose test when the two seem to disagree.
Fructosamine and glycated albumin
When A1C can’t be trusted, fructosamine or glycated albumin may be used instead. Both measure glucose stuck to blood proteins other than hemoglobin, so red cell problems don’t touch them, but they cover a much shorter window, usually 2 to 3 weeks, and glycated albumin results vary between methods. They’re most useful for people with sickle cell disease or another condition that rules out a reliable A1C, and for checking how glucose has changed over a few weeks rather than a few months.
Two Related Tests That Fill the Gaps
When a result lands on the border, the deciding test is often neither fasting insulin nor A1C.
The 2-hour glucose tolerance test
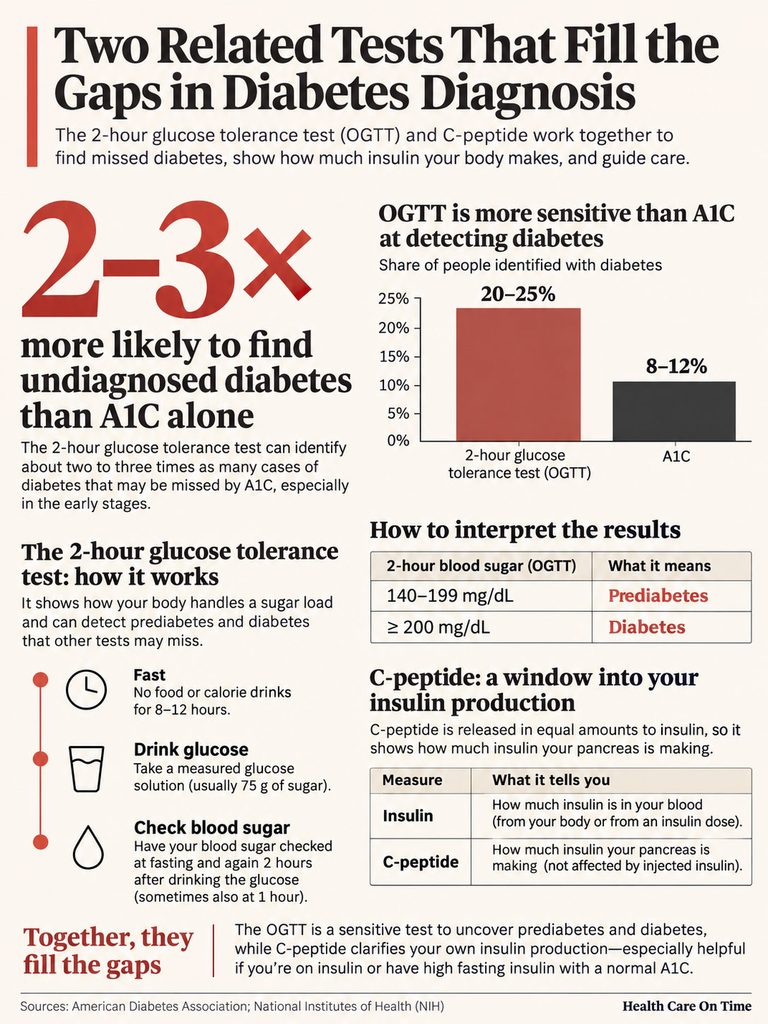
You fast overnight, have blood drawn, drink a measured glucose solution, and have blood sugar checked again at about 1 and 2 hours, sometimes 3. A 2-hour value of 140 to 199 mg/dL means prediabetes and 200 mg/dL or higher means diabetes.
It takes a morning and it’s less pleasant than a single draw, so it’s ordered less often. Even so, no glucose test is more sensitive. In the NHANES data above it found 90% of diabetes cases, compared with 30% for A1C, because it catches people whose fasting sugar is fine but who can’t clear a sugar load quickly. The 2-hour value is also thought to reflect beta-cell capacity best, meaning how much insulin the pancreas can still produce when pushed. For someone with a high fasting insulin and a normal A1C, it’s often the most informative next step.
C-peptide
When the pancreas makes insulin, it also releases a small fragment called C-peptide, which stays in the blood longer than insulin does. Measuring the two together gives a better estimate of how much insulin your own pancreas is producing. That matters most for people who inject insulin, since insulin from an injection doesn’t come with C-peptide made by your own pancreas, and for working out the cause of low blood sugar.
How to Prepare for Each Test
Insulin is the fussiest of these tests to prepare for.
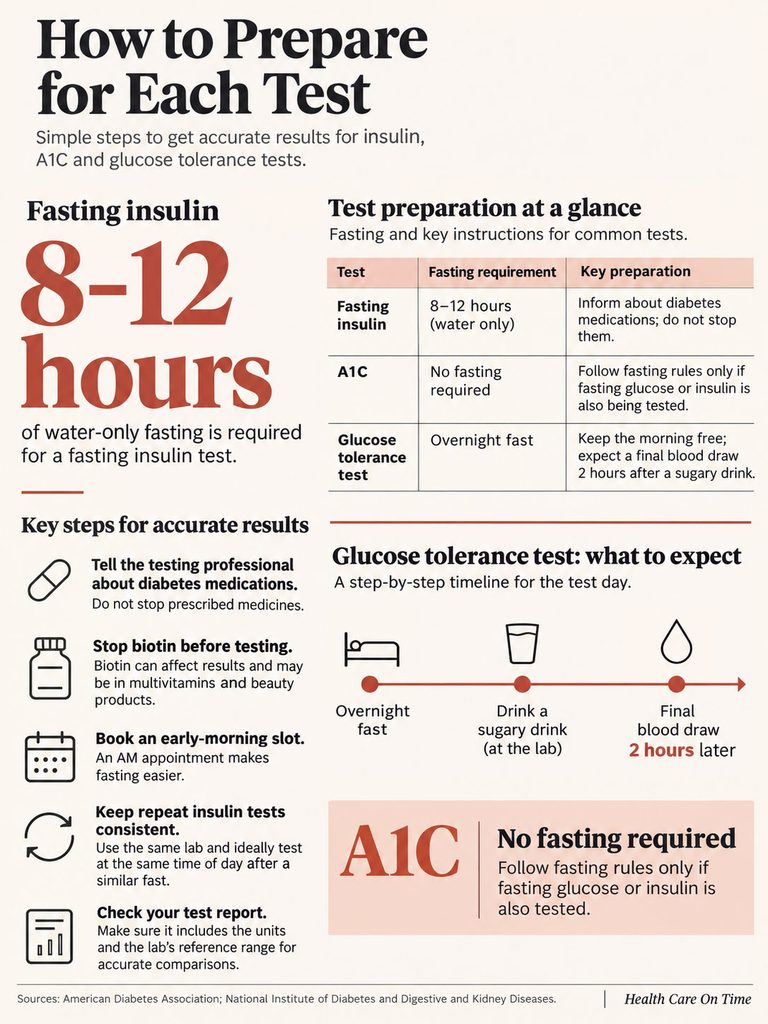
For fasting insulin, plan on 8 to 12 hours with nothing but water, and tell whoever orders the test about any insulin or other diabetes medicines you take, without stopping a prescribed medicine on your own. Stop biotin ahead of time. It hides in multivitamins and hair, skin and nail products, often listed under its other name, vitamin B7. An early-morning appointment makes the fast a lot easier.
A1C has no fasting requirement. If fasting glucose or insulin is drawn at the same visit, the fasting rules for those tests apply to the whole draw. A glucose tolerance test needs the same overnight fast plus a free morning, since the last blood draw comes 2 hours or more after the sugary drink; bring something to read and plan to eat once it’s over.
Repeat insulin tests should go to the same lab whenever possible, for the method reasons above, and ideally at about the same time of morning after a similar overnight fast. When the report comes back, check that it shows the units and the lab’s own reference range next to your number, because a bare figure without them can’t be compared with anything.
Which Test to Ask Your Doctor About
Screening in the US runs on glucose-based tests. The US Preventive Services Task Force recommends screening adults 35 to 70 who have overweight or obesity with fasting plasma glucose, A1C or an oral glucose tolerance test, and suggests that every 3 years may be reasonable when results are normal. For Asian Americans it suggests a lower body mass index cut point of 23. Fasting insulin doesn’t appear in the recommendation, and the NIDDK’s own page on insulin resistance says clinicians may not test for it at all, since the test is mainly used in research. A fasting insulin result can still be informative. What’s missing is any US guideline that says which number should lead to which action.
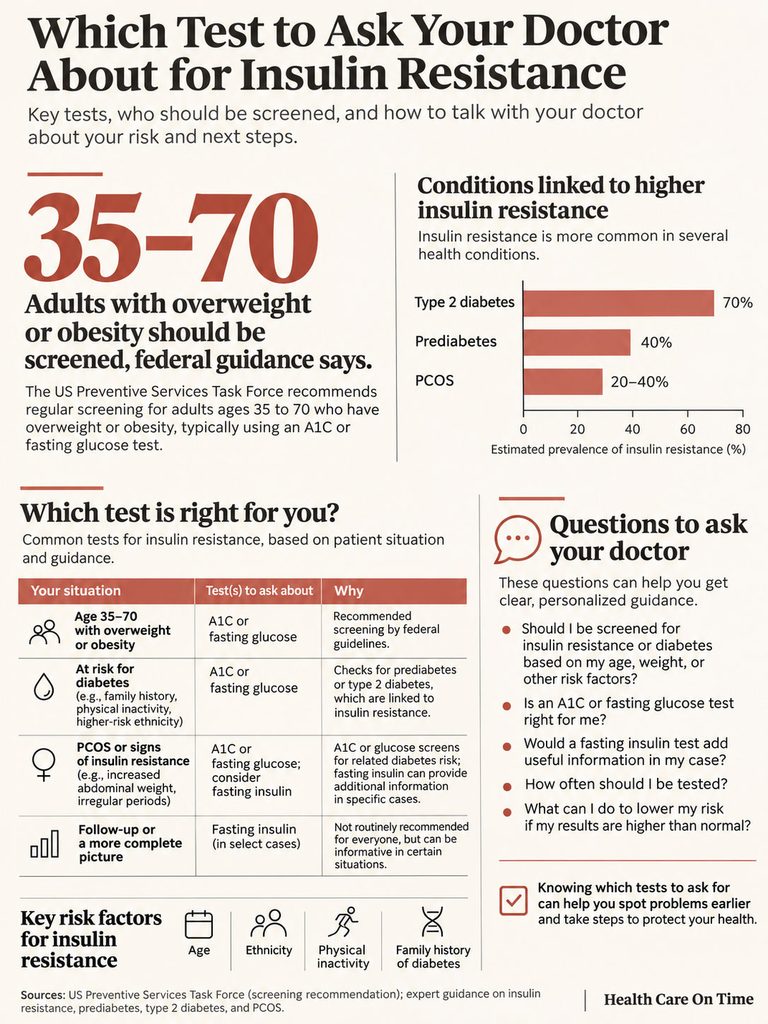
So if a doctor hesitates to order one, the usual reason is the lab problem described above: a result with no agreed cutoff, measured differently from lab to lab, is hard to act on. Explaining why you’re asking (a PCOS diagnosis, skin changes, a strong family history) gives the doctor something concrete to weigh, and it often leads to a glucose tolerance test, which answers part of the same question with agreed cutoffs.
For most adults, then, A1C or fasting glucose is the place to start, and a borderline result on one usually leads to the other or to a glucose tolerance test. Most primary care offices work through the types of diabetes tests in roughly that order.
Asking about fasting insulin makes more sense when signs of insulin resistance are obvious but glucose results still look normal. Some doctors order it with fasting glucose so they can calculate HOMA-IR. Conditions tied to higher insulin resistance risk include prediabetes, type 2 diabetes, polycystic ovary syndrome (PCOS), heart disease and acanthosis nigricans, the dark, velvety skin patches that often show up on the neck or in the armpits. Other risk factors add to the picture: overweight or a large waist, age 35 or older, a family history of diabetes, African American, American Indian, Asian American, Hispanic or Latino, or Pacific Islander ancestry, physical inactivity, smoking, gestational diabetes or a baby who weighed 9 pounds or more at birth, sleep apnea, Cushing’s syndrome, and medicines such as glucocorticoids, some antipsychotics and some HIV drugs. Several of these together with a normal A1C is a reasonable time to bring insulin up.
| Your situation | Test that usually helps | Why |
| Age 35–70 with overweight or obesity, no symptoms | A1C or fasting glucose | Matches USPSTF screening; repeat about every 3 years if normal |
| A1C 5.7–6.4% on one test | Repeat A1C or fasting glucose; sometimes a glucose tolerance test | Prediabetes is confirmed with a second result; yearly checks after that |
| Normal A1C but PCOS, acanthosis nigricans or a large waist | Ask whether fasting insulin with fasting glucose (HOMA-IR) adds anything | Insulin can rise before glucose does; there’s no standard cutoff |
| Sickle cell trait, anemia, recent blood loss or kidney disease | Fasting glucose or glucose tolerance test; sometimes fructosamine | A1C can read falsely high or low in these conditions |
| Shaky, sweaty or confused spells with low glucose | Insulin, C-peptide and glucose drawn while glucose is low | Finding the cause of low blood sugar is the insulin test’s main job |
| Already taking insulin injections | A1C and glucose logs; C-peptide if own production is in question | Antibodies and insulin analogues can make insulin results unreliable |
| Pregnant | Glucose testing on the prenatal schedule | Pregnancy changes red cell turnover and affects A1C |
Questions worth bringing to the visit
Appointments are short, so it helps to walk in with a few questions ready:
- Is the A1C enough this time, or should fasting glucose be added?
- With PCOS and a normal A1C, would a fasting insulin or HOMA-IR tell us anything new?
- Which lab range should this insulin result be compared with, and can the next test go to the same lab?
- Could anemia or sickle cell trait be throwing off this A1C?
- If it’s borderline, when should it be repeated?
- Would a glucose tolerance test be worth doing instead, since it catches more cases?
- Is a fasting insulin test likely to be covered, or is it out of pocket?
Reading Your Results Together
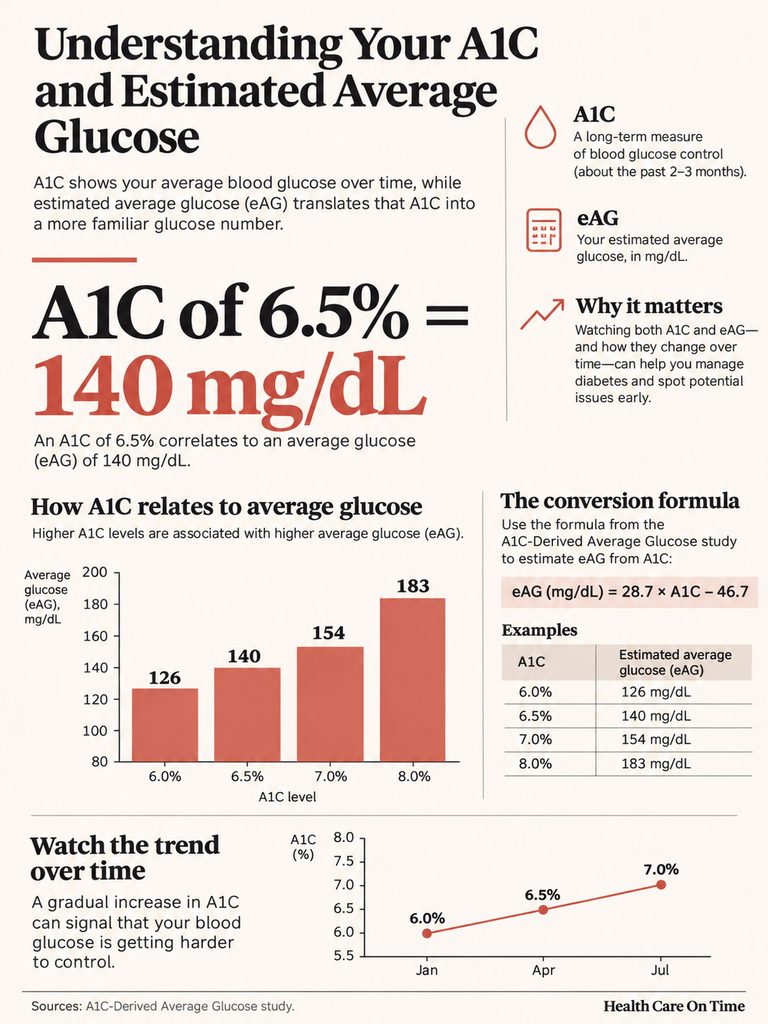
A1C can be translated into an estimated average glucose (eAG) in mg/dL with the formula from the A1C-Derived Average Glucose study: an A1C of 6% equals an average of about 126 mg/dL, 6.5% about 140 mg/dL, 7% about 154 mg/dL and 8% about 183 mg/dL. Those averages won’t match any single fingerstick, because they blend overnight lows with after-meal highs. Keep copies of past reports, too; a slow upward drift across several normal-range A1C results can say more than any one of them.
When the results come back together, the pattern usually suggests one of these:
- All three normal: no sign of a problem right now, so screening continues on the usual schedule.
- Normal A1C and glucose, high fasting insulin: possible early insulin resistance, with the pancreas likely compensating. Lifestyle changes have the most room to help at this stage, and a repeat at the same lab can confirm whether the reading holds up.
- A1C in the prediabetes range, insulin high or normal: glucose control is already slipping, and a repeat test usually confirms it.
- High A1C or glucose with low insulin: the pancreas may not be making enough insulin. Type 1 diabetes and pancreatitis are among the causes, and this pattern needs prompt follow-up.
- A1C and glucose that disagree: look for something affecting A1C (anemia, a hemoglobin variant, recent blood loss) before deciding which number to believe.
If Your Fasting Insulin Comes Back High
A high fasting insulin with a normal A1C is a reason to look closer, especially if other risk factors are present, rather than a diagnosis on its own. Ask for a repeat at the same lab, ideally with fasting glucose drawn at the same time, so the two can be read together.
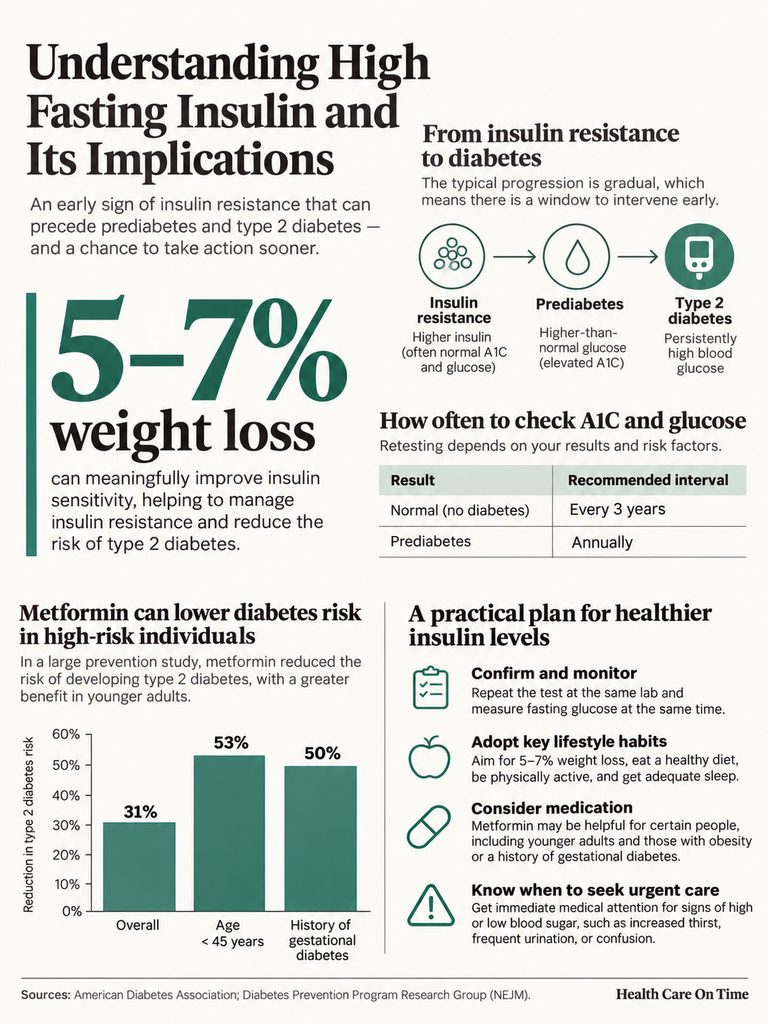
The steps that lower insulin resistance are the same ones that prevent type 2 diabetes. In the Diabetes Prevention Program, a large US trial, losing 5% to 7% of starting body weight lowered the chance of developing diabetes, and the follow-up study found that lifestyle changes or metformin prevented or delayed type 2 diabetes for at least 15 years. For someone who weighs 200 pounds, 5% to 7% means about 10 to 14 pounds. Beyond weight, the everyday advice is to eat healthy foods and drinks, be physically active and get enough sleep, starting with small changes, and the eating part is easier with a week of real meals planned out, like this budget-friendly 7-day meal plan for high blood sugar.
Metformin is the medicine most often discussed at this stage. It can help manage blood glucose and delay type 2 diabetes, and in the Diabetes Prevention Program it worked best for younger adults, people with obesity and women who’d had gestational diabetes. Whether it makes sense for you depends on your other results and your risk factors, which is a conversation for your doctor rather than a decision based on one insulin number.
Regular A1C or glucose checks still matter. With risk factors and normal results, retest at least every 3 years; with prediabetes, it’s yearly, since prediabetes carries a high chance of type 2 diabetes within 5 to 10 years.
See a doctor promptly, without waiting for a scheduled check, if you have increased thirst, frequent urination, blurry vision or unexplained weight loss, or if you have spells of shakiness, sweating, confusion or a racing heart that improve after eating. The first group can mean blood sugar is already high; the second can mean it’s dropping too low.
Frequently Asked Questions
Can you have high insulin but a normal A1C?
Yes. In early insulin resistance, the pancreas makes extra insulin to hold blood sugar steady, so A1C can sit below 5.7% for years while fasting insulin runs high.
Is your insulin level the same as your A1C?
No. Insulin is a hormone measured at one moment in mcIU/mL. A1C is a percentage of coated hemoglobin that reflects about 3 months of blood sugar. The two are related, since insulin controls the sugar that A1C records, but a number from one can’t be converted into the other.
Will taking insulin lower A1C?
For people with diabetes who need it, insulin lowers blood glucose, and A1C follows over the next few weeks to months. How low to aim depends on the person. Keeping A1C below 7% lowers complication risk for some people, while 7% to 8% may be the safer goal for someone with frequent low blood sugar, advanced complications or limited life expectancy. Bringing A1C down too fast can cause dangerous lows, so any change in insulin dose should come from your care team, not from a single lab result.
What comes first, insulin resistance or prediabetes?
Insulin resistance usually comes first. Cells stop responding well to insulin, the pancreas makes more to compensate, and glucose stays normal for a while, sometimes for many years. Only when the pancreas can’t keep up do fasting glucose and A1C start rising into the prediabetes range (A1C 5.7% to 6.4%, fasting glucose 100 to 125 mg/dL). From there, without changes, the chance of type 2 diabetes within 5 to 10 years is high. The path isn’t the same for everyone, though, and plenty of people with insulin resistance never develop diabetes, especially once they lose some weight and stay active.
What is a normal fasting insulin level?
There’s no national standard. Mayo Clinic Laboratories uses 2.6 to 24.9 mcIU/mL, but each lab sets its own range. The same blood sample can read differently on different methods, so compare your result with the range printed on your own report and use the same lab for repeats.
Does A1C show insulin resistance?
Only indirectly, and late. A1C tracks average blood glucose, and glucose often stays normal in early insulin resistance because the pancreas is compensating. Of the three glucose-based tests, A1C has the weakest link with insulin resistance.
Is fasting insulin a better test than A1C?
Each does a different job well. Fasting insulin can flag insulin resistance years before glucose rises, and in one study of working men it tracked metabolic syndrome more closely than A1C did. A1C needs no fasting, and its cutoffs are agreed on for diagnosing prediabetes and diabetes, while fasting insulin has no national cutoff and can differ from lab to lab. For screening, start with A1C or fasting glucose. Fasting insulin is a reasonable add-on question for people with clear signs of insulin resistance and normal glucose results.
Do you need to fast for an A1C test?
No. A1C reflects months of blood sugar, so one meal doesn’t change it. If fasting glucose is drawn at the same time, though, you’ll need to fast for that part.
Can fasting insulin be too low?
Low insulin with high blood glucose can mean the pancreas isn’t making enough, as in type 1 diabetes, pancreatitis or later-stage type 2 diabetes. In a lean, healthy person with normal glucose, a low fasting insulin can simply reflect good insulin sensitivity. Glucose results and your history decide which applies, so go over a low reading with your doctor.
Medical disclaimer: This article is for general information and isn’t a substitute for advice from a qualified health professional. Lab ranges differ, and your results should be interpreted by a clinician who knows your history. If you have symptoms of very high or very low blood sugar, seek care right away.
References
- MedlinePlus (National Library of Medicine). Insulin in Blood. https://medlineplus.gov/lab-tests/insulin-in-blood-test/
- Mayo Clinic Laboratories. Insulin, Serum (test 8664). https://www.mayocliniclabs.com/test-catalog/overview/8664/insulin-serum
- National Institute of Diabetes and Digestive and Kidney Diseases. The A1C Test & Diabetes. https://www.niddk.nih.gov/health-information/diagnostic-tests/a1c-test
- National Institute of Diabetes and Digestive and Kidney Diseases. Insulin Resistance & Prediabetes. https://www.niddk.nih.gov/health-information/diabetes/overview/what-is-diabetes/prediabetes-insulin-resistance
- National Institute of Diabetes and Digestive and Kidney Diseases. Sickle Cell Trait & Other Hemoglobinopathies & Diabetes. https://www.niddk.nih.gov/health-information/professionals/clinical-tools-patient-management/diabetes/sickle-cell-trait-hemoglobinopathies-diabetes
- Centers for Disease Control and Prevention. Diabetes Testing. https://www.cdc.gov/diabetes/basics/getting-tested.html
- Centers for Disease Control and Prevention. National Diabetes Statistics Report. https://www.cdc.gov/diabetes/php/data-research/index.html
- US Preventive Services Task Force. Screening for Prediabetes and Type 2 Diabetes: Final Recommendation Statement (2021). https://www.uspreventiveservicestaskforce.org/uspstf/document/RecommendationStatementFinal/screening-for-prediabetes-and-type-2-diabetes
- American Academy of Family Physicians. Task Force Lowers Age for Prediabetes, Diabetes Screening (2021). https://www.aafp.org/about/news/20210401uspstfprediabetes
- The Pros and Cons of Diagnosing Diabetes With A1C. Diabetes Care. 2011;34(Suppl 2):S184. https://diabetesjournals.org/care/article/34/Supplement_2/S184/28282/The-Pros-and-Cons-of-Diagnosing-Diabetes-With-A1C
- Saravia G, et al. Glycated Hemoglobin, Fasting Insulin and the Metabolic Syndrome in Males. Cross-Sectional Analyses of the Aragon Workers’ Health Study Baseline. PLoS One. 2015;10(8):e0132244. https://repisalud.isciii.es/entities/publication/32ac031f-93ba-41df-9801-fa3913104da5/full
- Miller WG, et al. Toward Standardization of Insulin Immunoassays. Clinical Chemistry. 2009;55(5):1011-1018. https://academic.oup.com/clinchem/article/55/5/1011/5629277
- Matthews DR, et al. Homeostasis model assessment: insulin resistance and beta-cell function from fasting plasma glucose and insulin concentrations in man. Diabetologia. 1985;28:412-419. https://www.rdm.ox.ac.uk/publications/72990
- Hulman A, et al. Trajectories of glycaemia, insulin sensitivity and insulin secretion in South Asian and white individuals before diagnosis of type 2 diabetes: Whitehall II. Diabetologia. 2017;60(7):1252-1260. https://discovery.ucl.ac.uk/id/eprint/1552762/
- Færch K, et al. Whitehall II cohort analysis of glycemic trajectories before diabetes diagnosis. Lancet Diabetes & Endocrinology. 2013;1:43-51. https://core.ac.uk/download/50566315.pdf
- American Diabetes Association. Estimated Average Glucose (A1C-Derived Average Glucose study). https://professional.diabetes.org/sites/default/files/media/average_glucose_flyer.pdf