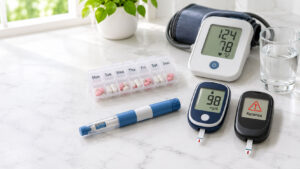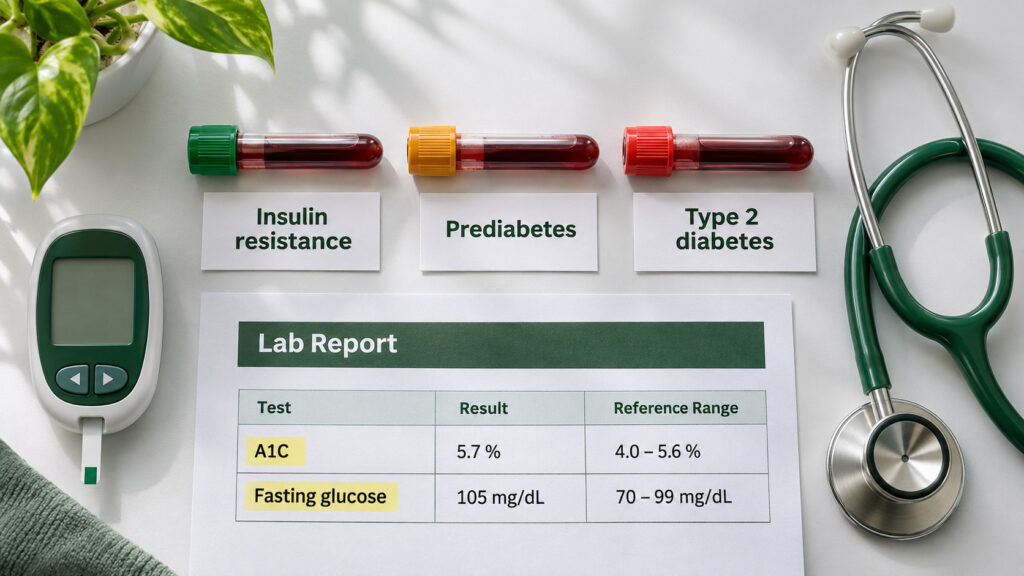
Insulin resistance is a problem with how your cells respond to insulin, while diabetes is a diagnosis based on how high your blood sugar has climbed. You can have the first for years without the second, and the blood tests that separate them are specific enough to read yourself once you know the cutoffs.
Table of Contents
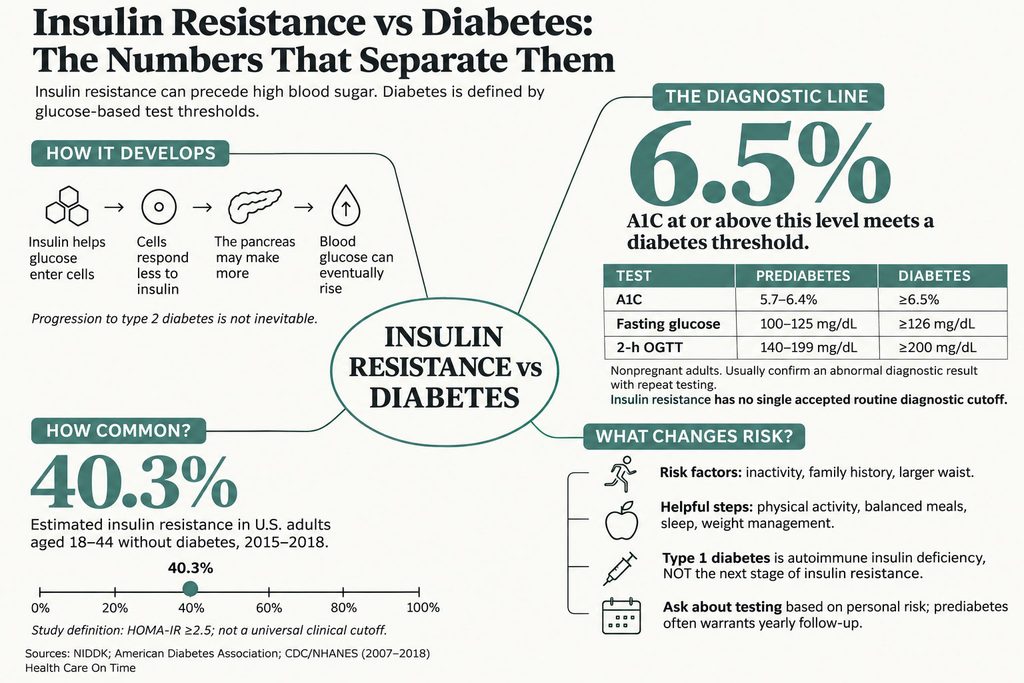
Quick answer: Insulin resistance means your cells respond poorly to insulin, so your pancreas makes extra to keep blood sugar normal. Diabetes is diagnosed when that effort fails and blood sugar rises past set cutoffs: an A1C of 6.5% or higher, fasting glucose of 126 mg/dL or higher, or a 2-hour glucose tolerance result of 200 mg/dL or higher. Insulin resistance has no official cutoff, often causes no symptoms, and usually improves with activity and weight loss.
How Insulin Resistance Turns Into Diabetes
Most people with type 2 diabetes had insulin resistance first, often for years before anyone checked, and the two conditions share one underlying process.
What insulin is supposed to do
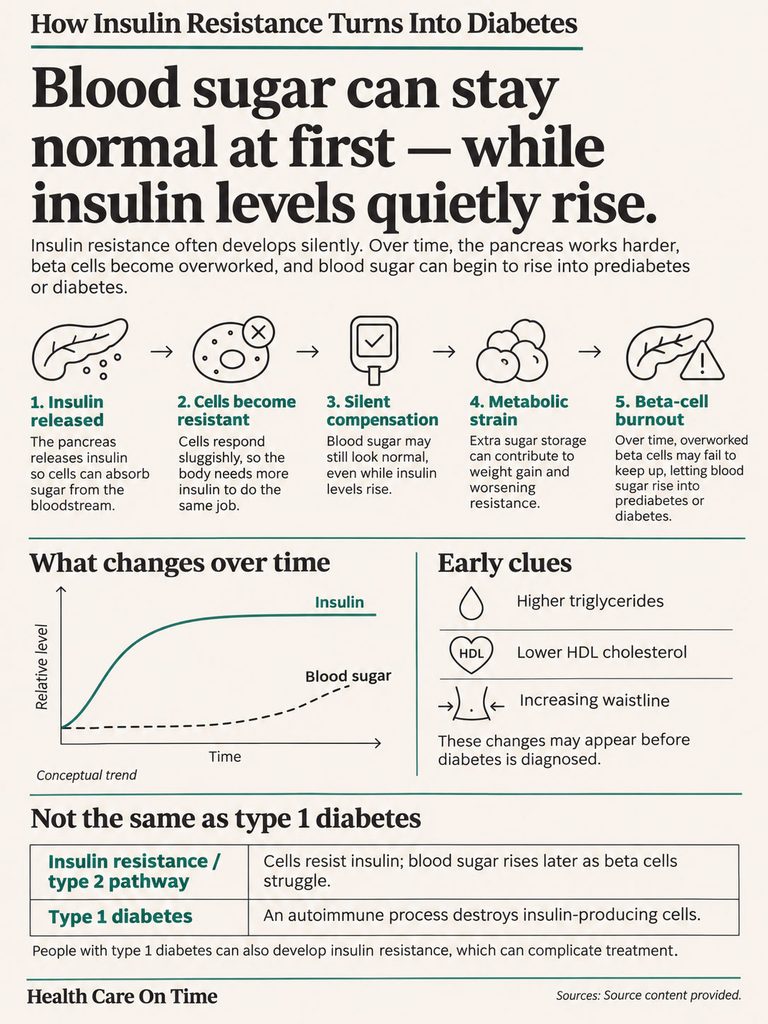
When you eat, your body breaks food down into sugar, and that sugar enters your bloodstream. Your pancreas responds by releasing insulin, a hormone that signals your cells to let sugar move out of the blood and into muscle, fat and liver cells where it can be burned for energy or stored. Insulin also tells the liver to hold on to extra sugar. Once the sugar has moved into cells, blood sugar drifts back down.
When cells stop responding
With insulin resistance, the insulin is there, but muscle, fat and liver cells answer it sluggishly, so it takes more insulin to move the same amount of sugar, and the pancreas compensates by pumping out more. For a while that works. Blood sugar stays normal even though insulin is running high, so most people feel nothing and have no reason to get tested.
Meanwhile, the extra sugar has to go somewhere. Your body stores what it can in the liver and muscles, and once those stores are full, the liver sends the rest off to be stored as body fat. Weight gain and insulin resistance travel together for exactly this reason, and it can be hard to tell which one started first.
For a lot of people, the first hint isn’t a glucose number. A routine cholesterol panel comes back with high triglycerides and low HDL cholesterol, or a doctor mentions a waistline that has crept up, while the A1C still sits in the normal range. None of that diagnoses anything by itself, but it’s the pattern insulin resistance tends to leave behind years before blood sugar moves.
Over time the resistance tends to deepen, and the beta cells in the pancreas that make insulin can wear out under the extra workload. When they can’t keep up, blood sugar climbs into the prediabetes range and, for many people, on into diabetes. Insulin resistance is a hallmark of both prediabetes and type 2 diabetes, and people with type 2 who have more severe resistance tend to need more medicine to reach their blood sugar targets.
Where type 1 diabetes fits
Type 1 diabetes follows a different path. It’s thought to be caused by an autoimmune reaction that destroys the insulin-making cells, so people with type 1 can’t make enough insulin to survive, whereas people with insulin resistance make plenty of insulin that works poorly. Insulin resistance does not cause type 1, though people with type 1 can still develop it on top of their diabetes. When they do, they need higher insulin doses, and some research links that resistance to heart disease and other complications.
Insulin Resistance, Prediabetes and Type 2 Diabetes Side by Side
The first three test rows below use the standard US diagnostic cutoffs for adults who aren’t pregnant; pregnancy has its own numbers. The HOMA-IR row is different in kind, since no guideline body has ever set an official cutoff for it.
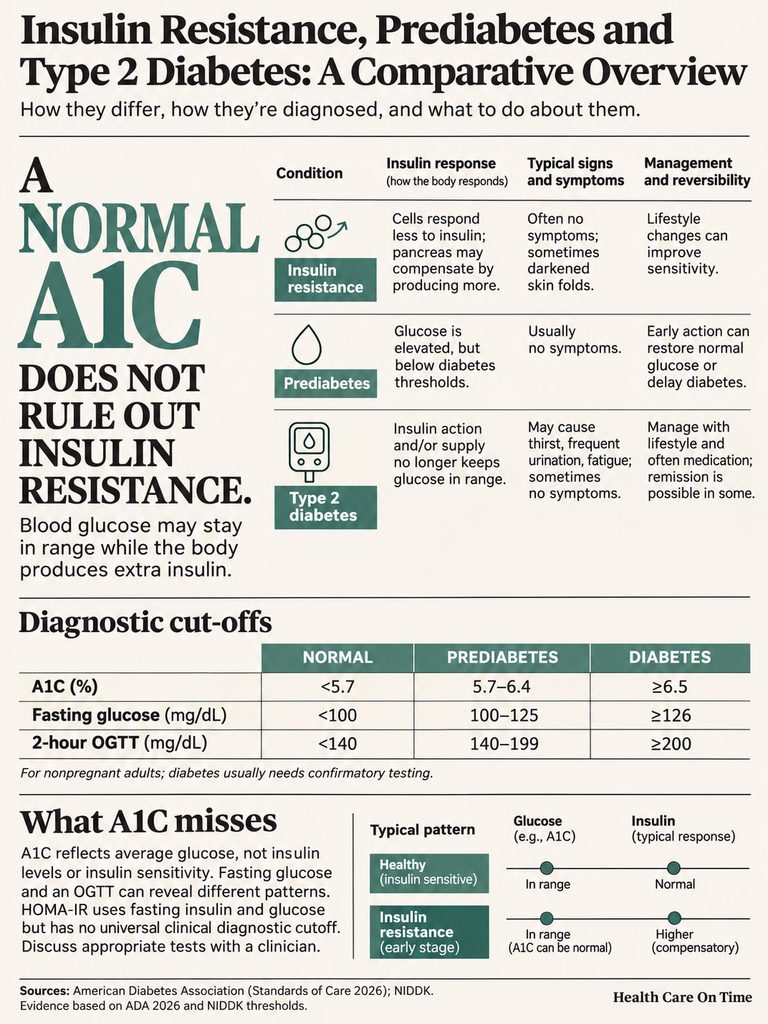
| Feature | Insulin resistance | Prediabetes | Type 2 diabetes |
| What’s happening in the body | Cells respond poorly to insulin; pancreas makes extra insulin to compensate | Pancreas can no longer fully keep up; blood sugar rises above normal | Blood sugar stays high enough to meet a diagnostic cutoff |
| A1C | Often below 5.7% (normal) | 5.7% to 6.4% | 6.5% or higher |
| Fasting plasma glucose (8-hour fast) | Often 99 mg/dL or below | 100 to 125 mg/dL | 126 mg/dL or higher |
| 2-hour glucose tolerance test (75 g drink) | Often below 140 mg/dL | 140 to 199 mg/dL | 200 mg/dL or higher |
| Fasting insulin / HOMA-IR | Raised; HOMA-IR of about 2.0 to 3.0 or above is commonly read as insulin resistance (no official cutoff) | Usually raised, though not needed for diagnosis | Not used for diagnosis; unreliable once insulin-making cells fail or insulin is injected |
| Typical signs | Usually none; sometimes dark, velvety skin in body folds (acanthosis nigricans) | Usually none | Thirst, frequent urination and blurred vision when sugar runs high, though many people feel nothing |
| How reversible | Cells can be made much more responsive; full elimination may not be possible | Progression can often be prevented or delayed | Remission is possible for some, defined as A1C below 6.5% for 3+ months off diabetes drugs |
Look closely at the first column. A person can sit in the “normal” range on all three blood sugar tests and still have high insulin levels holding those numbers in place, because the A1C, fasting glucose and glucose tolerance cutoffs were written to define prediabetes and diabetes. None of them was designed to detect insulin resistance on its own.
If your doctor has only ever ordered an A1C, a normal result tells you that you don’t meet the prediabetes or diabetes cutoff. It can’t tell you how hard your pancreas is working to keep you there.
The Tests, One by One
Two tests on the same person can disagree, and that’s expected: a normal fasting glucose next to an A1C in the prediabetes range is a common pairing at a single visit, because the recommended prediabetes tests each catch a slightly different group of people.
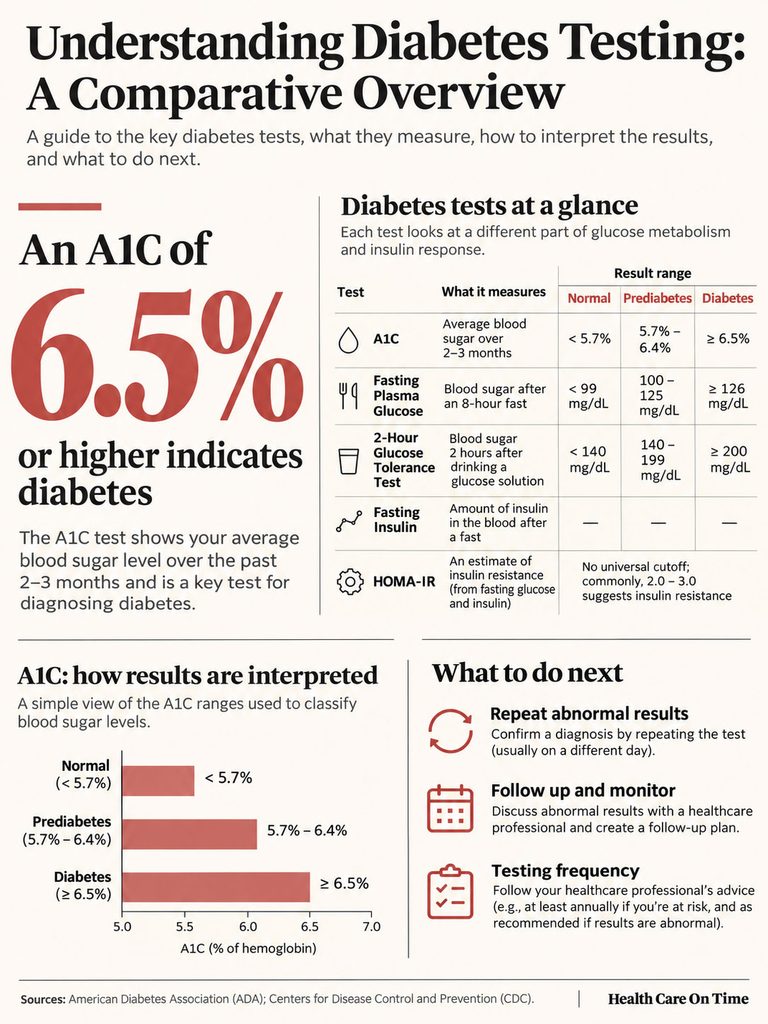
A1C
This test reads your average blood sugar over the past two to three months by checking how much sugar has stuck to hemoglobin in your red blood cells. No fasting needed. Anything under 5.7% counts as normal; 6.5% or higher meets the diabetes cutoff, with prediabetes in the gap between them.
Because it reflects months rather than a single morning, A1C is the test most doctors order first. It’s also the worst of the group at seeing insulin resistance, since a pancreas that is still compensating can keep the average looking perfectly fine. An average also smooths out swings. Someone whose sugar spikes after every meal and settles overnight can land on an unremarkable number, which is one reason a doctor who suspects trouble may add a fasting or 2-hour test instead of relying on A1C alone.
When the report arrives, look at the actual number rather than the word “normal” beside it. A result just under the prediabetes line and one well below it are both flagged normal, yet they point to quite different odds over the next few years.
Fasting plasma glucose
You’ll need to skip food and every drink except water for at least 8 hours, so the draw is normally booked first thing in the morning. Coffee with cream, a late snack or a sugary drink before the appointment can push the number up and send you back for a repeat.
Results of 99 mg/dL or below are normal. A reading from 100 to 125 mg/dL is prediabetes, sometimes called impaired fasting glucose, and 126 mg/dL or higher points to diabetes.
The 2-hour glucose tolerance test
The oral glucose tolerance test, or OGTT, shows how your body copes with a sugar load in real time. After an overnight fast you give a baseline sample, drink a liquid containing 75 grams of glucose, and wait. At the two-hour mark, a reading under 140 mg/dL is normal, while 200 mg/dL or higher means diabetes; anything from 140 to 199 mg/dL is impaired glucose tolerance, a form of prediabetes.
It takes a couple of hours in a lab chair and isn’t part of routine bloodwork, but it catches people whose trouble only shows after a meal. Some labs also draw blood at 1 hour and 3 hours, and results can shift with the size of the drink and how often blood is taken. A broken fast can make the 2-hour number useless, so follow the glucose tolerance test preparation your lab gives you to the letter.
Fasting insulin and HOMA-IR
Only this test looks at insulin resistance directly. A fasting insulin level is drawn at the same time as fasting glucose, and the two numbers go into a short formula:
HOMA-IR = fasting insulin (µU/mL) × fasting glucose (mg/dL) ÷ 405
Take a fasting glucose of 95 mg/dL with a fasting insulin of 12 µU/mL. The result is a HOMA-IR of about 2.8, which lands in the range many US clinicians read as insulin resistant, even though that glucose reading is completely normal.
Why there’s no official cutoff
HOMA-IR was developed in 1985 as a research tool, and a December 2025 review of the test found no universally accepted single cutoff. Values from 2.0 to 3.0 are the ones commonly used in US clinics and research, the national NHANES survey uses 2.5 or higher, and lower thresholds of roughly 1.4 to 2.5 have been proposed for Asian populations.
The score has real limits, too. Insulin results depend on which lab assay is used, so a number from one lab may not match a number from another. HOMA-IR is unreliable in people who already have diabetes or inject insulin, in very lean people, in adults over 60 and during acute illness or stress. It mostly reflects resistance in the liver rather than in muscle. That’s why the review advises against leaning on it alone for diagnosis or treatment decisions, and why doctors don’t routinely test for insulin resistance in standard diabetes care. The research gold standard, where insulin is infused into a vein while glucose is dripped in to keep blood sugar from falling, is far too involved for an office visit.
Why one abnormal result gets repeated
Each of the diabetes tests normally has to be repeated on a second day before a diagnosis is made. Skipping the repeat is reasonable only when blood sugar is very high, or when classic high-sugar symptoms such as heavy thirst and frequent urination come with one positive test. One bad morning, a lab error or a passing illness can all nudge a single result upward.
It works in the other direction as well. If your first result comes back normal but your doctor still suspects a problem, the next move is to repeat the test sooner than usual, for example within a year, or to confirm with one of the other two tests.
Can You Have Insulin Resistance Without Diabetes?
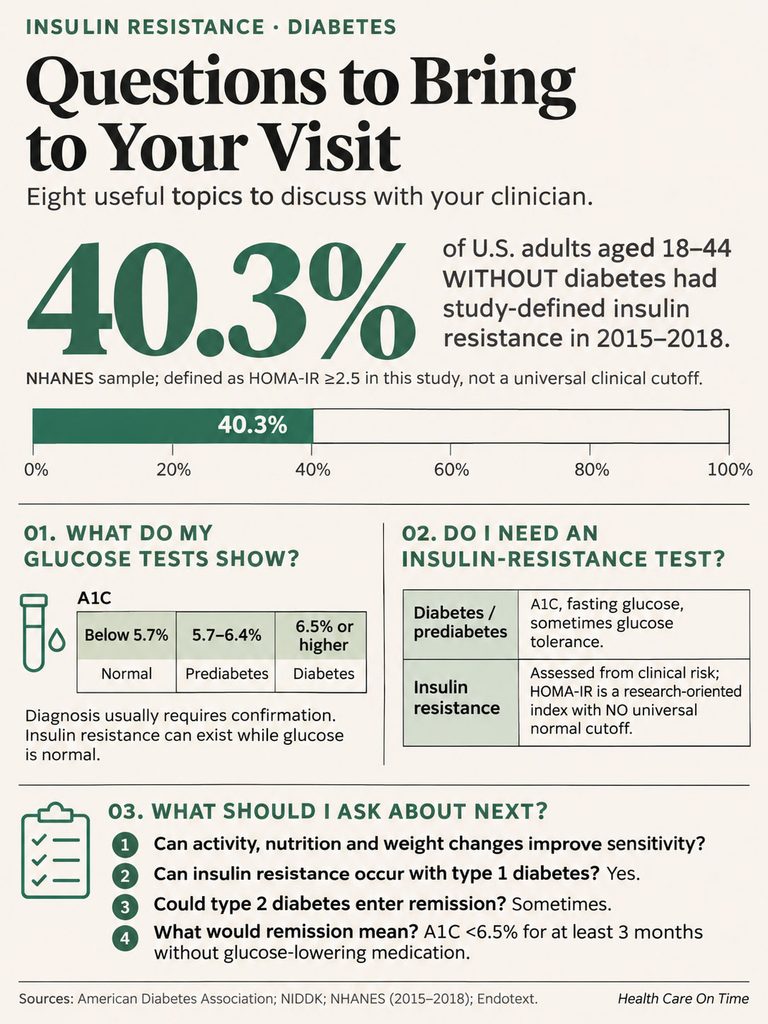
Yes, and plenty of young adults do. In national survey data on Americans ages 18 to 44 without diabetes, 44.8% had insulin resistance in 2007 to 2010 and 40.3% in 2015 to 2018 (a dip too small to count as a real change), based on a HOMA-IR of 2.5 or higher. Among the young adults with insulin resistance, 56.6% had obesity, against 14.7% of those without it, so nearly half of the insulin-resistant group did not have obesity.
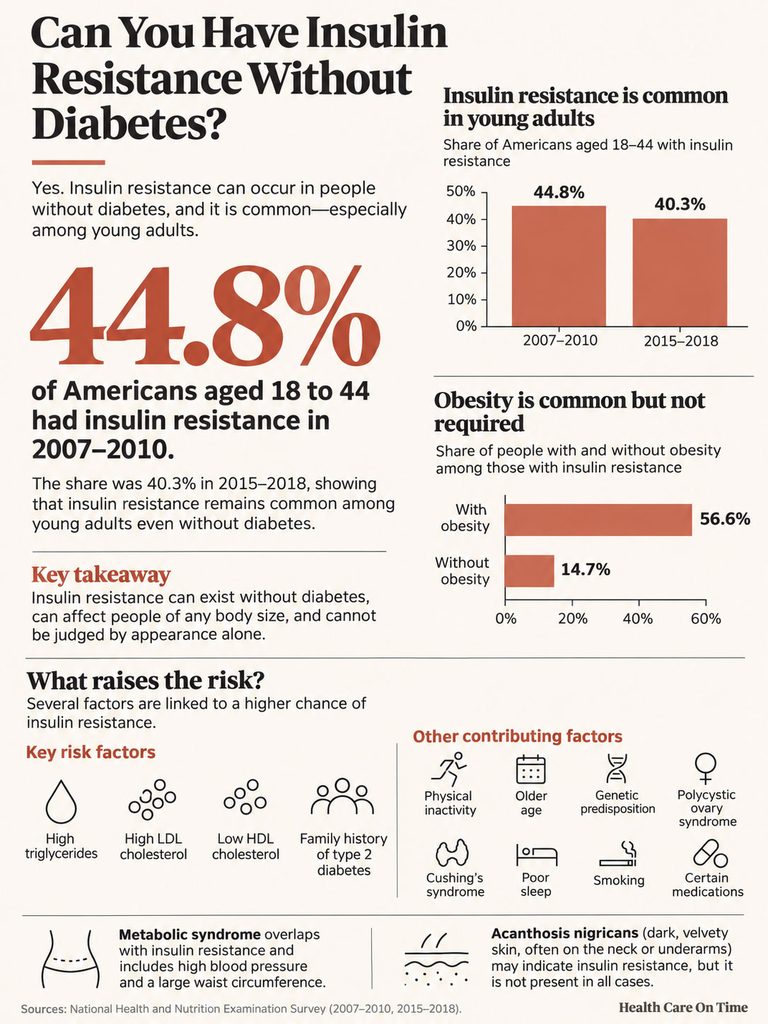
Weight, in other words, is a risk factor rather than a requirement, and you can’t spot insulin resistance by looking at someone. The other risk factors tend to show up on routine bloodwork or in your history: high triglycerides, high LDL cholesterol, low HDL cholesterol, a family history of type 2 diabetes, physical inactivity, older age and genes. Polycystic ovary syndrome, Cushing’s syndrome, poor sleep, smoking and certain medicines, including glucocorticoid steroids and some antipsychotics, also raise the odds. When several of these show up alongside high blood pressure and a large waist, the combination has its own name, metabolic syndrome, and it overlaps heavily with insulin resistance.
Dark, thick, velvety patches in body folds, such as the back of the neck or the armpits, are the one sign you might see in a mirror. Doctors call this acanthosis nigricans. Many people with insulin resistance never get it, so clear skin proves nothing, but those patches are a good reason to ask for blood sugar testing.
How Many Americans Are at Each Stage
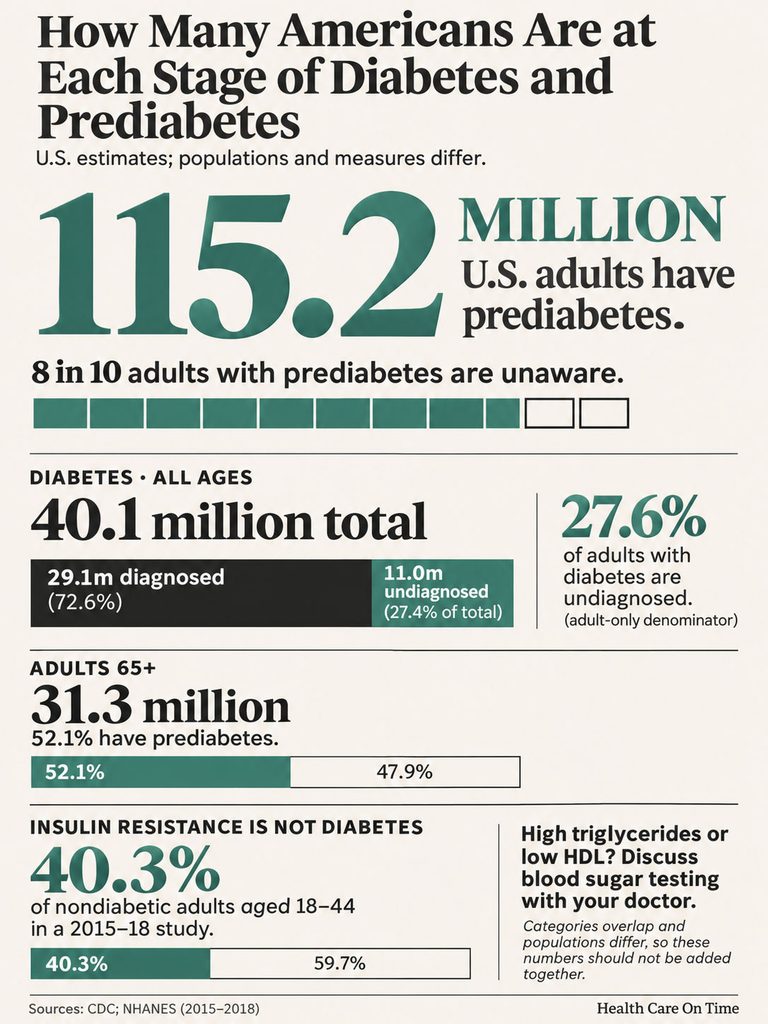
| Measure | Number | Source |
| People with diabetes, all ages (diagnosed or undiagnosed), 2023 | 40.1 million | CDC National Diabetes Statistics Report |
| People with diagnosed diabetes, all ages | 29.1 million | Same CDC report |
| Share of adults with diabetes who are undiagnosed | 27.6% (11.0 million) | Same CDC report |
| US adults with prediabetes | 115.2 million | Same CDC report |
| Adults 65 and older with prediabetes | 31.3 million (52.1%) | Same CDC report |
| Adults with prediabetes who don’t know it | 8 in 10 | CDC prediabetes fact sheet, 2026 |
| Nondiabetic adults ages 18 to 44 with insulin resistance (HOMA-IR 2.5 or higher), 2015 to 2018 | 40.3% | NHANES analysis, J Clin Endocrinol Metab, 2021 |
Insulin resistance gets no row of its own, because there’s no official test or cutoff to count it with. If your doctor has flagged high triglycerides or low HDL cholesterol in the past, mention it when you ask about blood sugar testing, since both show up on the risk list below.
Who Should Get Tested
Screening rules are built around risk, since prediabetes and early type 2 diabetes rarely announce themselves. The US Preventive Services Task Force gives a grade B recommendation, issued in 2021, to screen adults ages 35 to 70 who have overweight or obesity, and asks clinicians to offer or refer anyone with prediabetes to a prevention program that works.
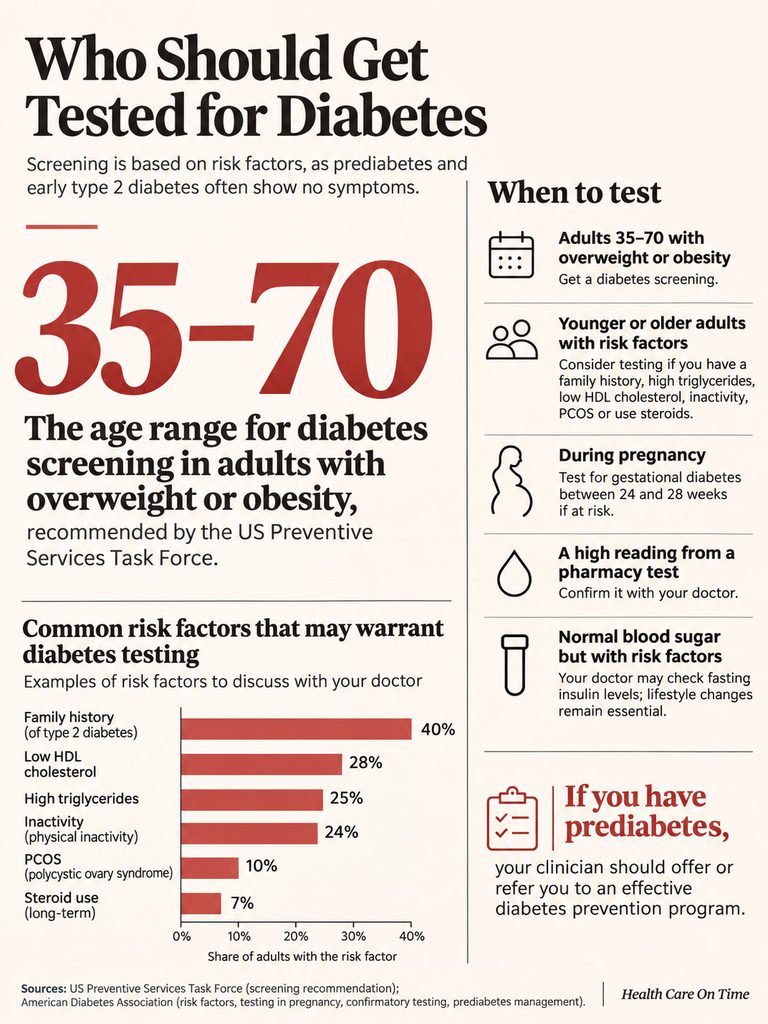
If you’re younger or older than that, the CDC still suggests asking your doctor about testing when you have any of the risk factors listed above, especially a family history of type 2 diabetes, high triglycerides or low HDL cholesterol, inactivity, PCOS or regular steroid use. Pregnancy is handled separately, with gestational diabetes testing usually done between 24 and 28 weeks, earlier for people at higher risk. And a high reading from a pharmacy kiosk or health fair belongs in front of your own doctor, who may repeat it.
If you’re in your early thirties with a parent who has type 2 diabetes, a desk job and a waist that has grown a few inches over the years, you sit outside the task force’s age range but still carry two or three risk factors from the list, which is reason enough to ask for a test.
When blood sugar comes back normal but you have several risk factors, or those skin patches, it’s fair to ask whether a fasting insulin level would change anything. If you’d be told to move more and sleep better either way, skipping it is a sensible call.
What Can Be Reversed, and What Usually Can’t
Insulin resistance
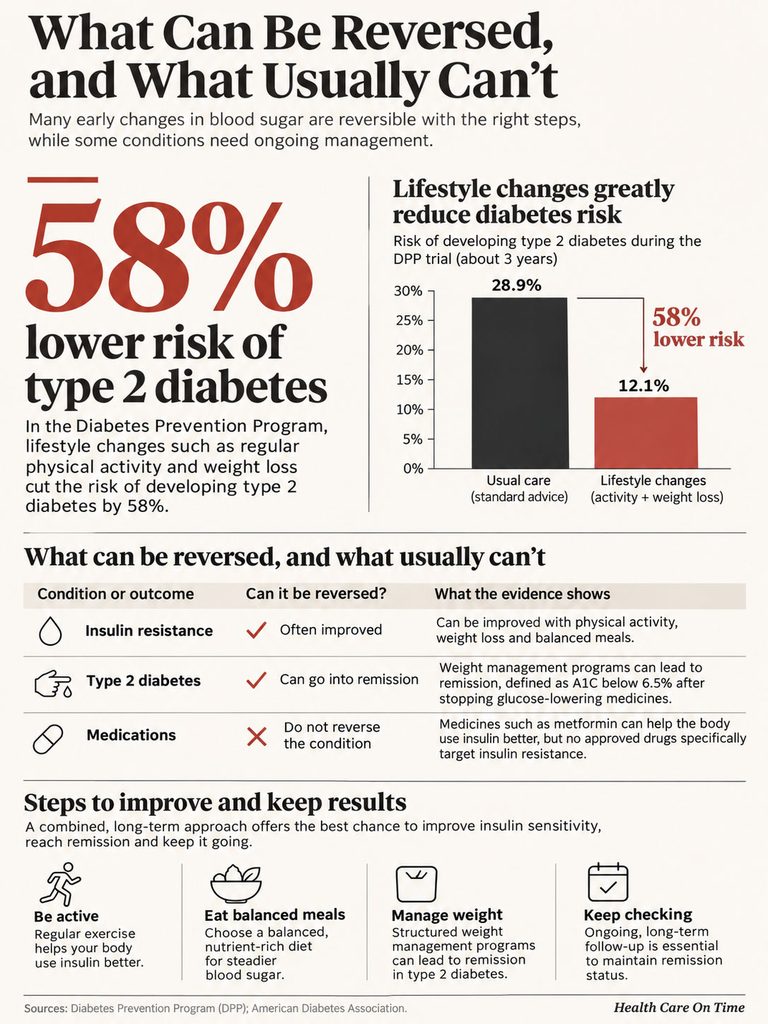
It may not be possible to wipe out insulin resistance entirely, but cells can be made a good deal more responsive. Physical activity does the most. It improves insulin sensitivity in the short and long term, and working muscles can pull sugar out of the blood through a route that doesn’t need insulin at all, which is why a walk after dinner helps even before your overall sensitivity changes.
Weight loss, if you carry extra weight, takes strain off the whole system, and people who have weight-loss surgery often become far more insulin sensitive afterward. No single diet has been proven best, but meals built around non-starchy vegetables, fruits, whole grains and lean proteins keep blood sugar lower, and lower blood sugar means your pancreas has to release less insulin to deal with it. Sleep and stress count here too, and none of it needs a special product or supplement; walking or cycling on most days with some strength training mixed in covers the exercise side for most people.
Prediabetes and the DPP trial
The strongest evidence comes from the Diabetes Prevention Program, which enrolled 3,234 people with prediabetes at 27 US centers. People in the lifestyle group aimed to lose 7% of their body weight and to exercise 150 minutes a week, and over about three years they cut their risk of type 2 diabetes by 58% compared with placebo. For participants 60 and older, the drop was 71%. Metformin lowered risk by 31%.
At 10 years the lifestyle group still had a 34% lower rate of diabetes and, on average, developed it about four years later than they otherwise would have; by 15 years the reduction had narrowed to 27%. If your plan includes a program like this, ask how long it runs and what follow-up testing comes after it. Lifestyle programs modeled on the DPP are the standard first step for prediabetes, with metformin sometimes added when lifestyle change alone falls short, and a GLP-1 medicine occasionally considered.
Remission in type 2 diabetes
The preferred word is remission rather than cure, and a 2021 expert consensus convened by the ADA defined it as an A1C below 6.5% measured at least three months after stopping all glucose-lowering medicine. Blood sugar can creep back up afterward, so people in remission keep getting checked, with active, ongoing follow-up rather than discharge from care.
In DiRECT, a UK trial run through family doctors’ practices, 46% of people in a structured weight-management program (68 of 149) were in remission after a year. Remission tracked weight closely, with 64% of those who kept off at least 10 kg (about 22 pounds) through two years still in remission. Far fewer managed to hold large losses, though. A quarter of the program group, 24%, had lost at least 15 kg (about 33 pounds) at 12 months, and by 24 months that share had fallen to 11%.
Medicines
There’s no drug approved specifically for insulin resistance. Metformin and the thiazolidinedione class are called insulin sensitizers because they lower blood sugar partly by reducing resistance. Once type 2 diabetes is established, treatment can widen to other drug classes, and some people eventually need insulin injections after their own insulin output has fallen too far for pills to close the gap.
Matching Your Result to a Next Step
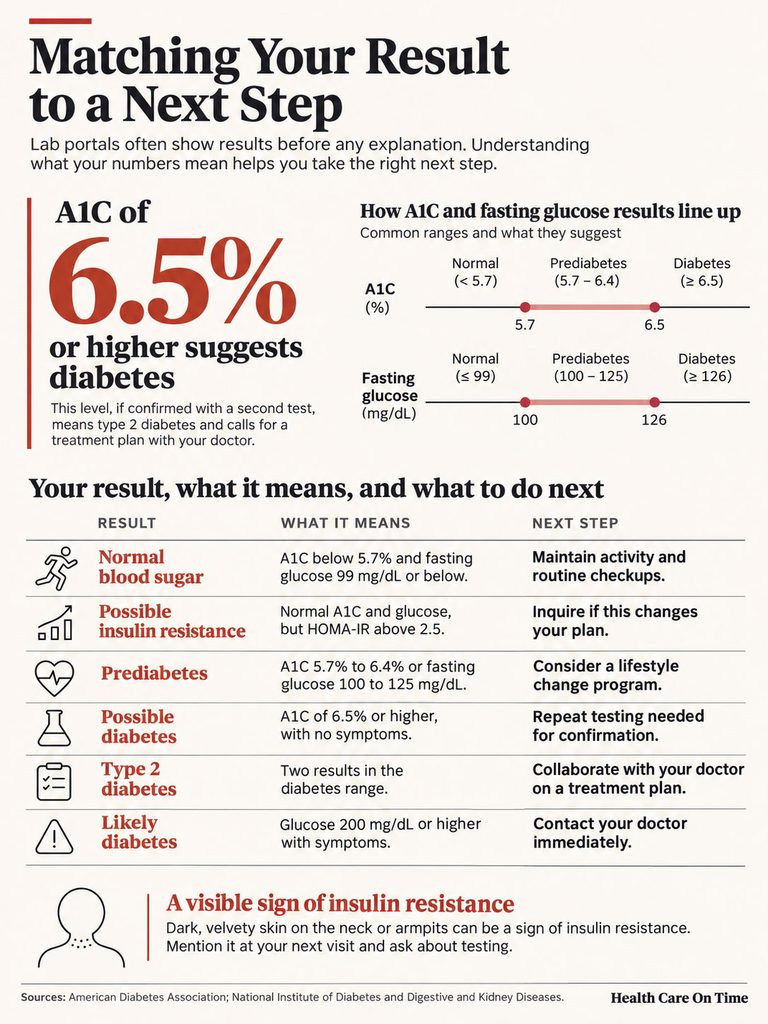
Lab portals post results before anyone has explained them, so it helps to know roughly what each pattern means before the follow-up call.
| If your result shows | What it likely means | Reasonable next step |
| A1C below 5.7%, fasting glucose 99 mg/dL or below, no risk factors | Normal blood sugar | Keep up activity and routine checkups; retest when your doctor advises |
| Normal A1C and glucose, but HOMA-IR above about 2.5 | Possible insulin resistance with blood sugar still controlled | Ask whether the result changes your plan; focus on activity, sleep and weight if relevant |
| A1C 5.7% to 6.4% or fasting glucose 100 to 125 mg/dL | Prediabetes | Ask about a lifestyle change program; recheck at the interval your doctor sets |
| One A1C of 6.5% or higher, no symptoms | Possible diabetes, not yet confirmed | Repeat testing on a second day before any diagnosis |
| Two results in the diabetes range | Type 2 diabetes (if type 1 is ruled out) | Build a treatment plan with your doctor, including diet, activity and medicine |
| Glucose 200 mg/dL or higher with heavy thirst, frequent urination or weight loss | Likely diabetes; a second test may not be required | Contact your doctor the same day |
| Dark velvety skin on the neck or armpits, normal labs | Possible insulin resistance sign | Mention it at your next visit and ask about testing |
A confirmed diagnosis needs a plan even if you feel fine, because years of high blood sugar quietly damage the eyes, kidneys, nerves and heart. If a result surprises you, ask for the full report, including the reference ranges your lab prints, since those can differ slightly from the cutoffs above. Get urgent care for vomiting with very high sugar, confusion, fruity-smelling breath or trouble breathing.
Questions to Bring to Your Visit
Bring the printout of your results, plus a few of these:
- “Are both of these results in the prediabetes range, or is one of them still normal?”
- “Would a fasting insulin or HOMA-IR test tell us anything new, or would it change the plan?”
- “Could one of the medicines on this list be pushing the blood sugar up?”
- “How soon should the A1C be checked again?”
- “Is there a lifestyle change program near here that insurance covers?”
- “If the second test comes back high too, what would the first step be?”
Frequently Asked Questions
Is insulin resistance the same as diabetes?
Insulin resistance means cells respond poorly to insulin while blood sugar may still be normal; diabetes is diagnosed only once blood sugar reaches set cutoffs, such as an A1C of 6.5% or higher.
How do you know if you are insulin resistant or diabetic?
Diabetes shows up on standard blood sugar tests: an A1C of 6.5% or higher, fasting glucose of 126 mg/dL or higher, or a 2-hour glucose tolerance result of 200 mg/dL or higher, normally confirmed on a second day. Insulin resistance is harder to pin down, because blood sugar can stay normal while insulin runs high. Doctors look at risk factors, triglycerides and HDL cholesterol, skin changes and sometimes a fasting insulin level used to calculate HOMA-IR. With no official cutoff for HOMA-IR, most treat it as one clue among several.
Can you have insulin resistance and not be diabetic?
Yes. About 40% of US adults ages 18 to 44 without diabetes had insulin resistance in 2015 to 2018, and nearly half of them did not have obesity.
Can you fix your insulin resistance?
You can improve it a lot, even if it never disappears completely. Regular physical activity is the strongest tool, since it raises insulin sensitivity and lets muscles take up sugar without needing insulin. Losing extra weight helps further, and better sleep and stress control support both. In the Diabetes Prevention Program, people with prediabetes who aimed for 7% weight loss and 150 minutes of weekly exercise cut their diabetes risk by 58%. Metformin can help too, though no medicine is approved specifically for insulin resistance.
Is prediabetes the same as insulin resistance?
Close, but not identical. Insulin resistance is a hallmark of prediabetes, yet you can have insulin resistance with completely normal blood sugar. Prediabetes has fixed cutoffs: an A1C of 5.7% to 6.4%, fasting glucose of 100 to 125 mg/dL, or a 2-hour glucose tolerance result of 140 to 199 mg/dL. Insulin resistance has no official cutoff at all.
What is a normal HOMA-IR?
No official normal range exists. Cutoffs between 2.0 and 3.0 are the ones most commonly used in the US to flag insulin resistance, and national survey research uses 2.5 or higher. Lab methods differ, so compare results from the same lab when you can.
Does insulin resistance cause type 1 diabetes?
Type 1 is thought to come from an autoimmune attack on insulin-making cells, so insulin resistance isn’t the cause. People with type 1 can develop resistance on top of it and then tend to need higher insulin doses.
Can type 2 diabetes go into remission?
Remission means an A1C below 6.5% at least three months after stopping diabetes medicines, and some people do reach it. In one UK trial, 46% of people in a structured weight-loss program reached remission at 12 months, and it was most common among those who kept off at least 22 pounds. Checkups continue, because blood sugar can rise again.
Does insulin resistance cause symptoms?
Most people feel nothing early on, because the pancreas holds blood sugar steady by making extra insulin. The main visible sign some people get is acanthosis nigricans, dark velvety skin on the neck or in the armpits.
Medical disclaimer: This article is for general information and is not a substitute for medical advice, diagnosis or treatment. Lab reference ranges can differ slightly between laboratories, and cutoffs differ during pregnancy. Talk with your doctor about your own results before changing your diet, activity or medicines.
References
- Centers for Disease Control and Prevention. About Insulin Resistance and Type 2 Diabetes.
- Centers for Disease Control and Prevention. Diabetes Tests.
- Centers for Disease Control and Prevention. National Diabetes Statistics Report. Updated September 16, 2026.
- Centers for Disease Control and Prevention. Prediabetes fact sheet (2026).
- American Diabetes Association. Insulin Resistance.
- American Diabetes Association. Diabetes Diagnosis.
- National Institute of Diabetes and Digestive and Kidney Diseases. Recommended Tests for Identifying Prediabetes.
- National Institute of Diabetes and Digestive and Kidney Diseases. Diabetes Prevention Program (DPP).
- Insulin Resistance and Cardiometabolic Risk Profile Among Nondiabetic American Young Adults: Insights From NHANES. Journal of Clinical Endocrinology & Metabolism, 2021. PubMed.
- Ambalavanan J. Updated Review of HOMA-IR. Evidence to Action: Official Journal of MDCalc, December 2025.
- Consensus report: Definition and interpretation of remission in type 2 diabetes. Diabetes Care, 2021;44(10):2438-2444. Record.
- Durability of a primary care-led weight-management intervention for remission of type 2 diabetes: 2-year results of the DiRECT trial. The Lancet Diabetes & Endocrinology, 2019;7(5):344-355. Record.
- US Preventive Services Task Force. Screening for Prediabetes and Type 2 Diabetes: Recommendation Statement. 2021.
- Stony Brook Medicine. Insulin Resistance vs. Prediabetes: What’s the Difference and Why It Matters. October 2025.