
The number most Americans quote for the average woman’s height comes from a survey cycle that ended nearly a decade ago. Federal data has been updated twice since then. The figure moved, the age breakdown changed, and almost nobody noticed.
Table of Contents
Quick Answer
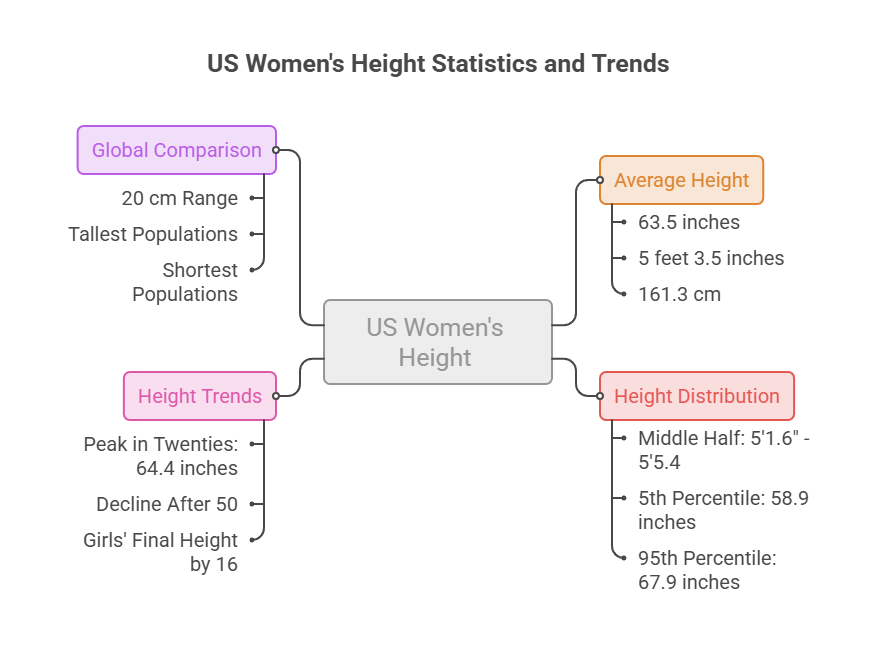
The average height for women in the United States is 63.5 inches, or 5 feet 3.5 inches (161.3 cm). That figure comes from CDC measurements taken between August 2021 and August 2023. Half of American women fall between 61.6 and 65.4 inches. Age matters: women in their twenties average 64.4 inches, while women 80 and older average 61.7 inches.
At a Glance
- US women age 20 and older average 63.5 inches (5 feet 3.5 inches, 161.3 cm), measured by trained examiners rather than self-reported.
- The middle half of American women stand between 5 feet 1.6 inches and 5 feet 5.4 inches.
- Height peaks in the twenties at 64.4 inches and declines steadily after 50.
- The 5th percentile is 58.9 inches and the 95th percentile is 67.9 inches, a spread of nine inches.
- Girls reach roughly their final height by 16, gaining only 1 to 3 inches after a first period.
- Globally, average female height ranges about 20 cm from the tallest populations to the shortest.
- An average describes a population. By definition, half of all women fall below it.
What the Average Height for Women Really Is
The Current CDC Number
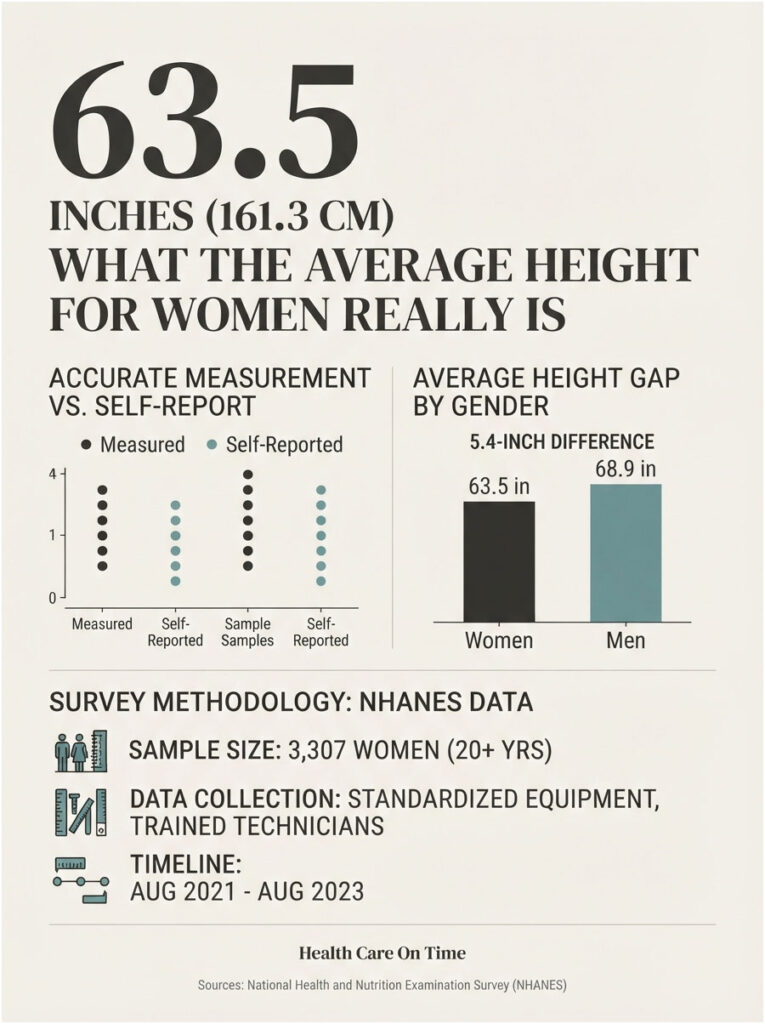
The most recent federal figure puts the average height for women age 20 and older at 63.5 inches, alongside an average weight of 171.8 pounds and a waist circumference of 38.5 inches. That works out to 5 feet 3.5 inches, or 161.3 cm.
The data comes from the National Health and Nutrition Examination Survey, run by the National Center for Health Statistics. The current release covers August 2021 through August 2023 and draws on body measurements from 8,545 participants age 2 and older.
Within that sample, 3,307 women age 20 and older were measured for standing height. That is the group behind the 63.5-inch figure.
For comparison, the same release puts men age 20 and older at 68.9 inches. The gap between American men and women runs about 5.4 inches, which has held remarkably steady across survey cycles.
Why You See 5 Feet 4 Inches in Some Places
Search around and you’ll find 5 feet 4 inches quoted almost as often as 5 feet 3.5 inches. Both numbers were correct at some point, which is exactly the problem.
The higher figure traces back to earlier NHANES cycles. One widely read health site still reports the average as just under 5 foot 4 inches based on 2016 data. Half an inch sounds trivial, but it changes where a reader places herself on the chart.
The 64-inch number also survives because it’s rounder and easier to remember. Our medical reviewers see this pattern constantly: the memorable version of a statistic outlives the accurate one.
There’s a second source of confusion. Some pages report the average height for women in centimeters incorrectly, printing 165 cm next to 5 feet 3.5 inches. The correct conversion is 161.3 cm. If a page shows both units and they don’t match, treat the whole page with caution.
Measured Height Versus What People Report
Ask a group of women how tall they are and the average will land higher than a stadiometer says. People round up, they remember their height from age 22, and they measure themselves in shoes.
NHANES avoids all of that. Participants are measured in a mobile examination center by trained health technicians, without shoes, against a wall-mounted stadiometer.
That methodological difference is why federal anthropometric data is the reference point clinicians use, and why self-reported survey numbers run consistently high. In the diagnostic intake work we support, the gap between what patients state and what the stadiometer records is routine enough that staff are trained to measure rather than ask.
Women’s Height Chart by Age
Peak Height Sits in the Twenties
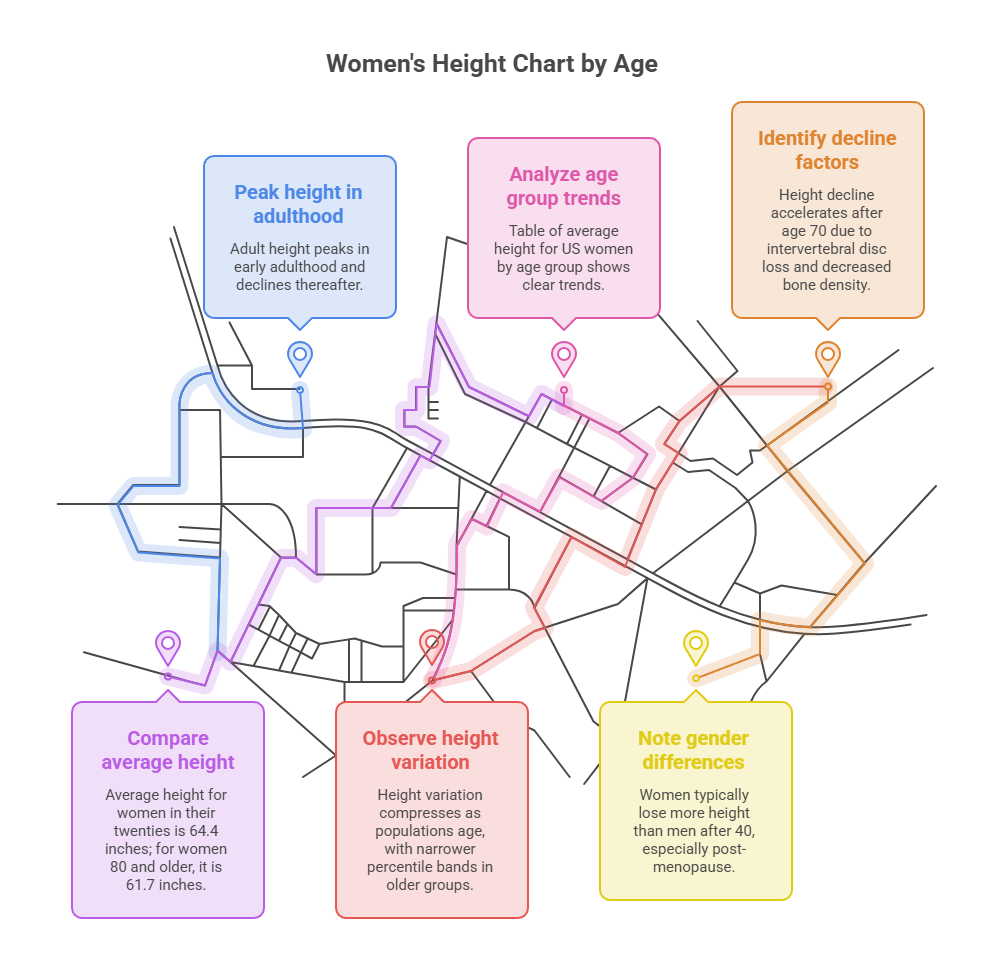
Adult height is not a single fixed number across a lifespan. It peaks in early adulthood, holds roughly steady through midlife, and then declines.
The average height for women by age shows this clearly in the current federal data. Women in their twenties average 64.4 inches. Women 80 and older average 61.7 inches, a gap of 2.7 inches.
Table 1. Average Height for US Women by Age Group
| Age group | Mean (inches) | Mean (cm) | 25th pct (in) | 50th pct (in) | 75th pct (in) |
| 20 to 29 | 64.4 | 163.6 | 62.4 | 64.3 | 66.2 |
| 30 to 39 | 64.0 | 162.6 | 62.3 | 64.1 | 65.9 |
| 40 to 49 | 63.7 | 161.8 | 61.9 | 63.8 | 65.5 |
| 50 to 59 | 63.5 | 161.3 | 61.6 | 63.3 | 65.4 |
| 60 to 69 | 63.2 | 160.5 | 61.3 | 63.1 | 65.0 |
| 70 to 79 | 62.3 | 158.2 | 60.8 | 62.2 | 63.9 |
| 80 and older | 61.7 | 156.7 | 59.5 | 61.8 | 63.8 |
| All women 20+ | 63.5 | 161.3 | 61.6 | 63.5 | 65.4 |
Source: National Center for Health Statistics, NHANES August 2021 to August 2023, Table 8.
Read the middle three columns together and something useful appears. The 25th to 75th percentile band shifts downward with age, but it also narrows slightly in the oldest group. Height variation compresses as populations age.
The Slow Decline After Fifty
Two separate processes drive the drop. The intervertebral discs lose water content and flatten, and bone density falls, particularly after menopause.
Typical age-related loss runs about a quarter to half an inch per decade after 40, adding up to more than three inches by age 80 in women, compared with about two inches in men.
The rate accelerates after 70. That acceleration is the part worth watching, because it separates normal aging from something treatable.
Women lose more than men for a specific reason. Estrogen protects bone density, and the drop at menopause removes that protection over a compressed period. Men experience a slower, steadier decline without an equivalent cliff.
Age Bands Are Not Only About Aging
One caveat that competing articles skip: an 80-year-old woman measured today was born in the 1940s. She grew up under different nutrition and healthcare conditions than a woman born in 2000.
So the difference between the 20 to 29 band and the 80-plus band reflects both real height loss and a genuine generational difference in adult height reached. Both effects are real, and a cross-sectional table cannot separate them.
The practical takeaway matters more than the statistics. If you’re 70, comparing yourself to the 70 to 79 row tells you where you sit among peers. Comparing your current height to your own height at 25 tells you something about your bones.
Where You Actually Land: The Percentile Picture
A Percentile Tells You More Than an Average
An average compresses a nine-inch range into one number. A percentile tells you what share of American women are shorter than you, which is the answer most people are actually looking for.
Table: Height Percentiles for US Women Age 20 and Older
| Percentile | Height (inches) | Feet and inches | Height (cm) |
| 5th | 58.9 | 4 ft 10.9 in | 149.6 |
| 10th | 59.8 | 4 ft 11.8 in | 151.9 |
| 25th | 61.6 | 5 ft 1.6 in | 156.5 |
| 50th | 63.5 | 5 ft 3.5 in | 161.3 |
| 75th | 65.4 | 5 ft 5.4 in | 166.1 |
| 90th | 67.1 | 5 ft 7.1 in | 170.4 |
| 95th | 67.9 | 5 ft 7.9 in | 172.5 |
Source: NHANES August 2021 to August 2023, adult female height in inches.
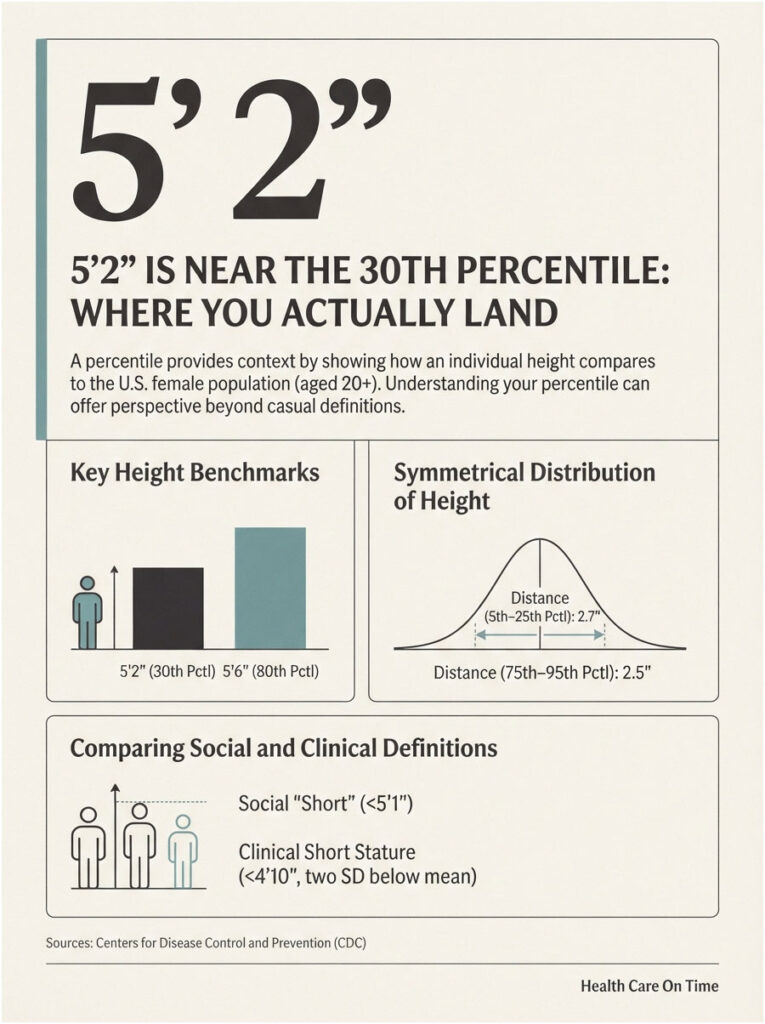
Read it this way. At 5 feet 2 inches you’re near the 30th percentile, which means roughly seven in ten American women are taller. At 5 feet 6 inches you’re around the 80th. At exactly 5 feet 3.5 inches you’re at the midpoint, with as many women above you as below.
One more thing the table shows: the distance from the 5th to the 25th percentile is 2.7 inches, and the distance from the 75th to the 95th is 2.5 inches. The distribution is close to symmetrical, which is why a bell curve describes height well.
What Counts as Short and What Counts as Tall
There is no official cutoff for short or tall in everyday use. In casual American terms, women below about 5 feet 1 inch read as short and women above about 5 feet 7 inches read as tall, because those points sit near the 10th and 95th percentiles.
Neither label carries medical meaning on its own. Half of all women are shorter than average, which is what an average is.
Petite adds its own confusion because it’s a clothing category, not a measurement. Most American retailers cut petite sizing for women under 5 feet 4 inches, which covers slightly more than half the female population.
The Clinical Definition of Short Stature
Medicine uses a stricter threshold. The American Association of Clinical Endocrinologists defines short stature as height more than two standard deviations below the mean for age and sex, which captures the shortest 2.3 percent of people.
For US women, two standard deviations below the mean lands near 58 inches, or about 4 feet 10 inches. That is a screening trigger, not a diagnosis.
Patients who ask us about this are usually reassured to learn the clinical bar sits well below where they assumed. A woman at 5 feet flat is at roughly the 12th percentile, which is short by social standards and entirely unremarkable medically.
Height Charts for Girls, Age 2 Through 19
Average Height for Girls by Age
Parents searching for the average height for women are often really asking whether a daughter is on track. The same federal data set answers that.
Table: Average Height for US Girls by Age
| Age (years) | Mean height (inches) | Mean height (cm) | 50th percentile (in) |
| 2 to 3 | 37.2 | 94.5 | 37.1 |
| 4 to 5 | 42.9 | 109.0 | 42.7 |
| 6 to 7 | 48.3 | 122.7 | 48.1 |
| 8 to 9 | 53.1 | 134.9 | 52.7 |
| 10 to 11 | 58.5 | 148.6 | 58.0 |
| 12 to 13 | 61.6 | 156.5 | 61.9 |
| 14 to 15 | 62.8 | 159.5 | 62.7 |
| 16 to 17 | 63.6 | 161.5 | 63.4 |
| 18 to 19 | 63.6 | 161.5 | 63.8 |
Source: NHANES August 2021 to August 2023, Table 6.
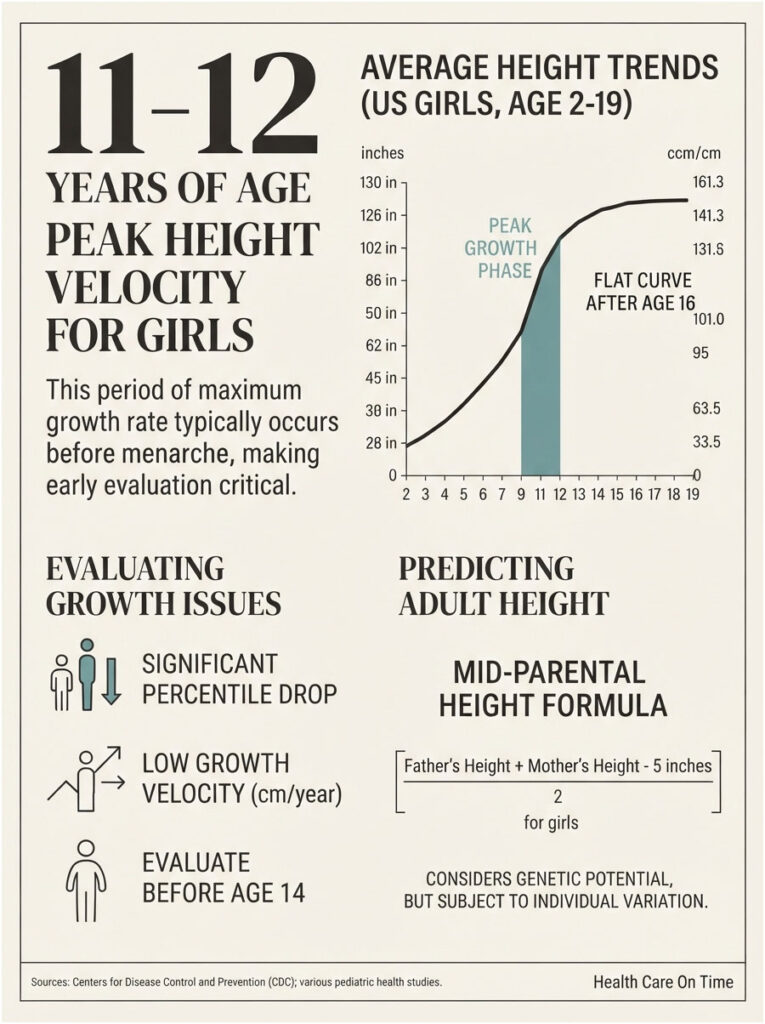
Notice how flat the curve goes after 16. By that point most girls are within a fraction of an inch of their adult height.
Notice also the jump between the 8 to 9 band and the 12 to 13 band: 8.5 inches in four years. That single stretch accounts for most of the growth spurt, and it arrives earlier for girls than for boys.
Peak Growth Comes Before a First Period
The common assumption is that girls grow through their teens. The data says otherwise.
Peak height velocity typically arrives around ages 11 to 12, roughly 6 to 12 months before menarche. By the time a first period arrives, the fastest growth has already happened.
After menarche, a typical girl gains somewhere between 1 and 3 inches before her growth plates close. Parents waiting for a first period as the signal to check on growth are, statistically, checking a little late.
This timing has a practical consequence. If a girl’s growth looks slow at age 9 or 10, that is the window where evaluation and treatment still have room to work. Waiting until 14 narrows the options considerably.
Predicting Adult Height
Pediatricians use a simple estimate called mid-parental height. For a girl: add the mother’s height and the father’s height, subtract 5 inches, then divide by two.
Worked example: a mother at 64 inches and a father at 70 inches gives 64 plus 70 minus 5, divided by two, which equals 64.5 inches. The daughter’s expected adult height centers on 5 feet 4.5 inches.
That gives a midpoint. Most girls land within about 2 inches on either side, though some references quote a wider range of 4 inches.
Why the Range Is So Wide
Height is polygenic. A study covering more than 5 million people identified over 12,000 genetic variants associated with height.
With that many variants shuffling between generations, two sisters raised identically can end up several inches apart. The formula gives you a center of gravity, not a prediction.
Bone age imaging, usually a hand and wrist X-ray, narrows the estimate considerably when a pediatrician needs precision. It shows how much growth plate remains open rather than inferring it from age alone.
When a Pediatrician Investigates
The trend matters more than any single measurement. A girl tracking steadily at the 30th percentile is fine. A girl dropping from the 60th to the 20th over two years is worth a conversation.
Growth velocity below about two inches per year before puberty is another common trigger for evaluation. So is a child whose height sits far below what her parents’ heights predict.
Families who book pediatric thyroid and growth panels through HealthCareOnTime typically arrive with a chart, not a symptom. The chart is usually the reason.
How US Women Compare Worldwide
The Tallest and Shortest Populations
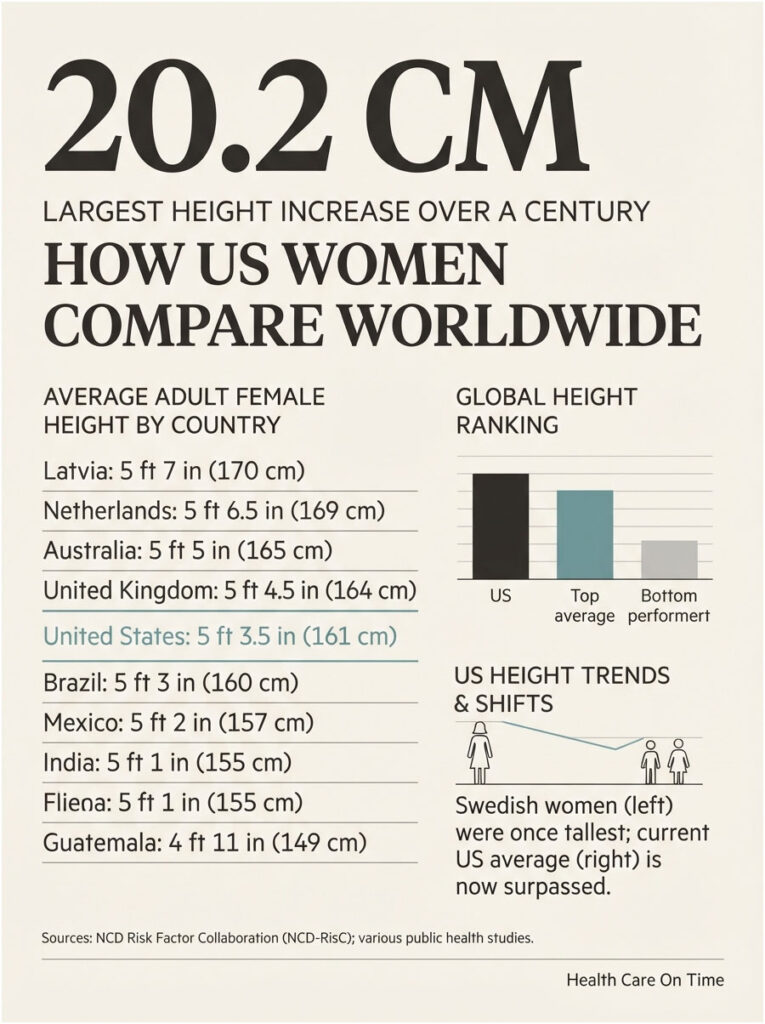
American women sit in the middle of the global range, not near the top. Northern and Eastern European populations lead.
Table: Average Adult Female Height, Selected Countries
| Country | Approximate average | Metric |
| Latvia | 5 ft 7 in | 170 cm |
| Netherlands | 5 ft 6.5 in | 169 cm |
| Australia | 5 ft 5 in | 165 cm |
| United Kingdom | 5 ft 4.5 in | 164 cm |
| United States | 5 ft 3.5 in | 161 cm |
| Brazil | 5 ft 3 in | 160 cm |
| Mexico | 5 ft 2 in | 157 cm |
| India | 5 ft 1 in | 155 cm |
| Guatemala | 4 ft 11 in | 149 cm |
Sources: NCD Risk Factor Collaboration and Cleveland Clinic country comparisons.
In 2014, Latvian women were the tallest measured population and Guatemalan women the shortest, and the gap between the tallest and shortest countries has held near 20 cm across a century.
The height difference between men and women has also stayed roughly constant worldwide, at about 11 cm a century ago and 12 cm more recently.
A Century of Change
The single most useful study here pooled 1,472 population-based studies covering more than 18.6 million participants across 200 countries, tracking birth cohorts from 1896 to 1996.
The standout finding involves South Korea. South Korean women gained 20.2 cm over that century, the largest increase recorded for any female population.
For scale, Guatemalan women born in 1896 averaged 140.3 cm, about the height of a well-nourished 10-year-old girl today.
Swedish women were the tallest population a century ago, averaging 160.3 cm. That figure is now below the current US average, which shows how much the whole distribution has shifted upward.
Why US Growth Stalled
American height climbed through most of the 20th century and then flattened. Countries that started shorter kept climbing and passed the United States in the rankings.
Researchers point to childhood nutrition quality, healthcare access in early life, and changes in population composition. No single explanation accounts for the whole plateau, and the debate is genuinely unsettled.
One pattern is clear from the pooled data: countries such as Japan, Singapore, and France gained more height than the global median with little change in body mass index, while the United States gained less height and far more weight.
What Actually Determines a Woman’s Height
Genetics Carries Most of the Load
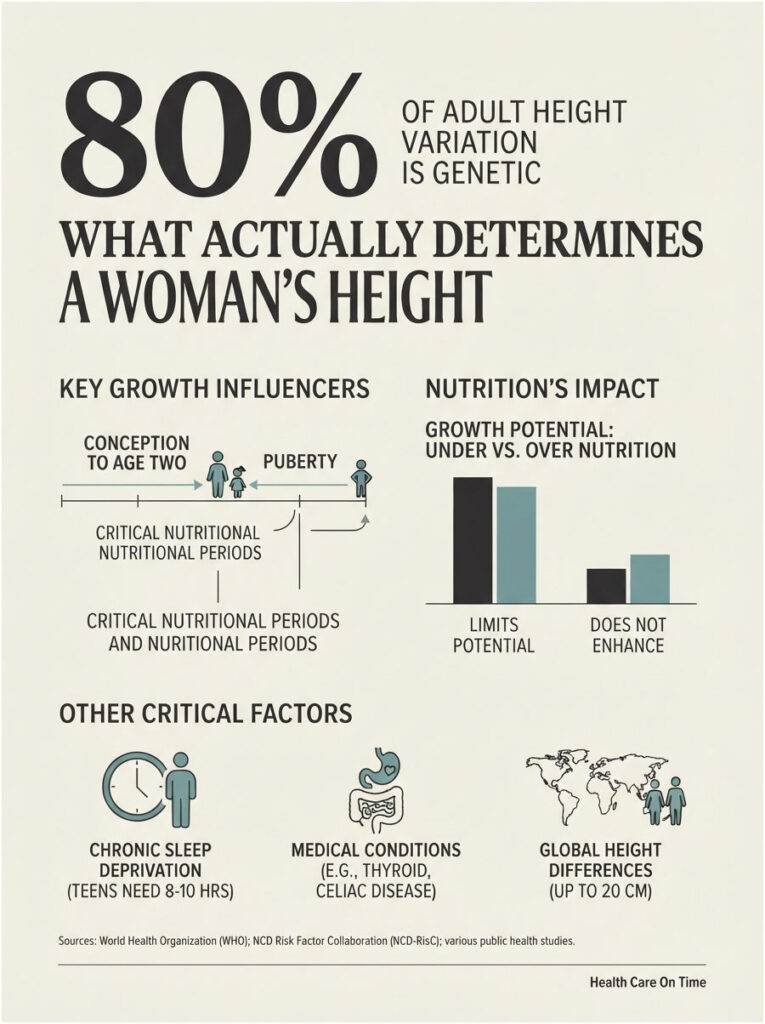
Estimates put the heritable share of adult height at roughly 80 percent. That is high, though it does not mean height is fixed at conception.
Heritability describes how much of the variation within a population traces to genetic differences. In a well-nourished population, most remaining variation is genetic, because nutrition has stopped being the limiting factor.
In populations where childhood nutrition varies widely, environment explains far more. This is why the same trait can look 80 percent genetic in one country and considerably less in another.
Nutrition in Two Windows
Two periods matter most: the first 1,000 days from conception through age two, and puberty. Protein, calcium, vitamin D, zinc, and total calories all feed linear growth during those windows.
The relationship is asymmetric. Undernutrition can keep a girl below her genetic potential. Overnutrition cannot push her above it.
This asymmetry is worth stating plainly because it undercuts an entire category of marketing. No food, drink, or supplement raises a child above her genetic ceiling. Adequate nutrition simply removes the obstacle.
Sleep, Illness, and Hormones
Growth hormone releases largely during deep sleep, which is why chronic sleep restriction in adolescence can blunt growth. Teens generally need 8 to 10 hours.
Untreated thyroid disease, celiac disease, and inflammatory bowel disease all interfere with growth. Patients who book thyroid panels with us often arrive after a pediatrician flagged a growth curve, not a symptom.
Precocious puberty works differently. An early estrogen surge accelerates bone maturation and closes growth plates sooner, and girls with untreated precocious puberty often finish about 2 to 3 inches shorter than their parental heights would predict.
Race, Ethnicity, and a Gap in the Current Data
The current NHANES anthropometry release reports by sex and age only. The last cycle to publish adult height by race and Hispanic origin covered 2015 to 2018.
In that cycle, non-Hispanic Black women averaged 64.0 inches, non-Hispanic White women 63.9 inches, Hispanic women 62.0 inches, and non-Hispanic Asian women 61.5 inches.
These are population patterns shaped by ancestry, generational nutrition, and immigration history together. They predict nothing about any individual. The spread within any one group is far wider than the difference between group averages.
Table 2. US and Global Women’s Height by the Numbers
| Statistic | Figure | Source and year |
| Mean height, US women 20+ | 63.5 in (161.3 cm) | NCHS, NHANES Aug 2021 to Aug 2023 |
| Middle 50 percent range | 61.6 to 65.4 in | NCHS, NHANES Aug 2021 to Aug 2023 |
| 5th to 95th percentile spread | 58.9 to 67.9 in | NCHS, NHANES Aug 2021 to Aug 2023 |
| Mean at ages 20 to 29 vs 80+ | 64.4 vs 61.7 in | NCHS, NHANES Aug 2021 to Aug 2023 |
| Ethnic range, US women | 61.5 to 64.0 in | NCHS, NHANES 2015 to 2018 |
| Global tallest vs shortest | About 20 cm apart | NCD-RisC, eLife 2016 |
| Century gain, South Korean women | 20.2 cm | NCD-RisC, eLife 2016 |
| Height-associated genetic variants | Over 12,000 | Yengo et al., Nature 2022 |
| Mean height, US men 20+ | 68.9 in | NCHS, NHANES Aug 2021 to Aug 2023 |
Compiled by the HealthCareOnTime medical review team from the sources listed.
When Height Becomes a Medical Signal
Short Stature That Deserves a Workup
Being shorter than average is not a medical finding. Being well below the family pattern is.
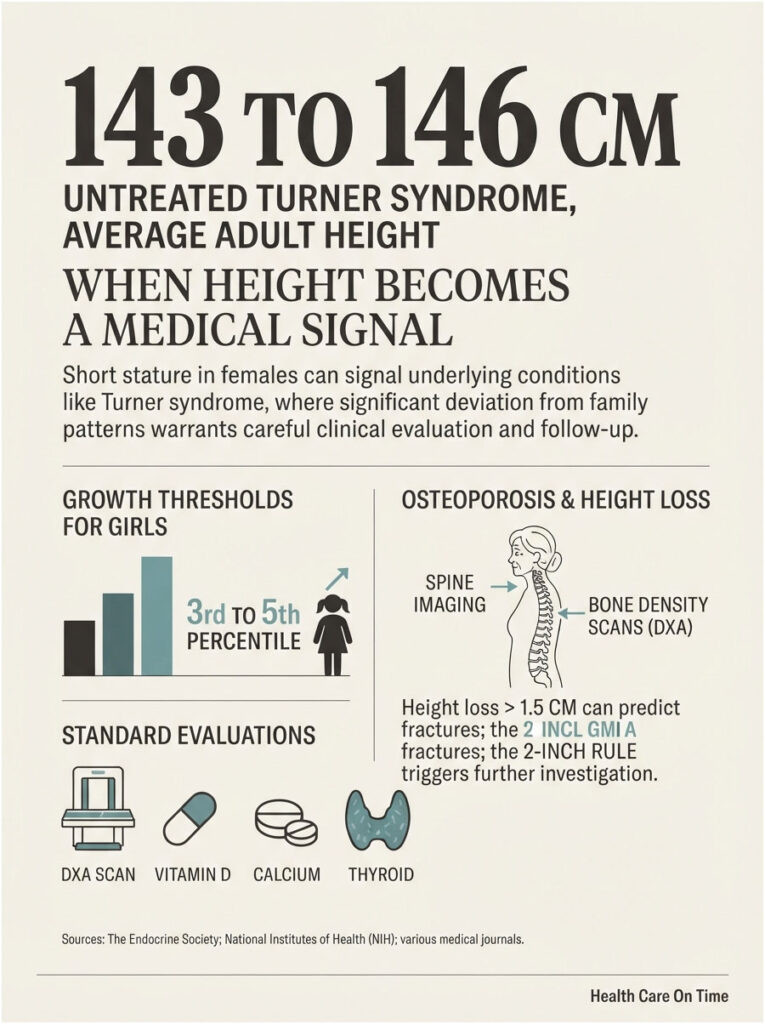
The clearest red flag is a mismatch: a girl tracking below the 3rd to 5th percentile when both parents are average height. That combination prompts evaluation more often than an absolute number does.
Research on Turner syndrome clinics shows the value of this comparison directly. Comparing a girl’s height against the lower end of her parental target range detected 85 percent of cases, yet both parents had been measured in only 55 percent of the girls attending.
Turner Syndrome and Endocrine Causes
Turner syndrome is the most common chromosomal cause of short stature in girls. Untreated adult height in women with Turner syndrome averages about 143 to 146 cm, roughly 20 cm below both their mid-parental target and the average for women in their country.
The Turner Syndrome Foundation puts untreated final height at an average near 4 feet 7 inches, and notes short stature is the single most common physical finding in the condition.
The pattern is distinctive. Before age 11 some girls have height and growth rates within the normal range, though usually below the 50th percentile, and the adolescent growth spurt is essentially absent. That missing spurt is often what finally makes the diagnosis obvious.
Growth hormone deficiency, untreated hypothyroidism, and precocious puberty are the other endocrine causes clinicians look for. Each is treatable, and each responds better the earlier it’s caught.
Unexpected Height Loss in Adulthood
Losing a quarter to half an inch per decade after 40 is expected. Losing considerably more, or losing it quickly, is not.
One screening model found that age over 65 combined with height loss greater than 1.5 cm, along with a low femoral neck T-score, independently predicted osteoporotic vertebral compression fractures.
A study of 457 postmenopausal women over 55 found mean height loss of 3.47 cm in those who went on to fracture, against 2.50 cm in those who did not, and identified height loss as an independent predictor of fracture alongside bone density and prior fracture.
The Two-Inch Rule
Clinicians commonly use a loss of about two inches from peak adult height as the trigger for spine imaging and a bone density scan. Some use a lower threshold in women with other risk factors.
The measurement that matters is against your own maximum height in early adulthood, not against a population chart. This is why writing your height down at 25 turns out to be useful at 65.
What a Clinician Typically Orders
For adult height loss, the standard workup includes a DXA bone density scan, vitamin D, calcium, and sometimes thyroid and parathyroid testing. Lateral spine imaging follows if fractures are suspected.
Across the diagnostic network we serve, bone-health panels booked by women over 55 are among the most common follow-ups after a documented height change.
Height and Health Risk: What the Research Shows
The Cardiovascular Findings
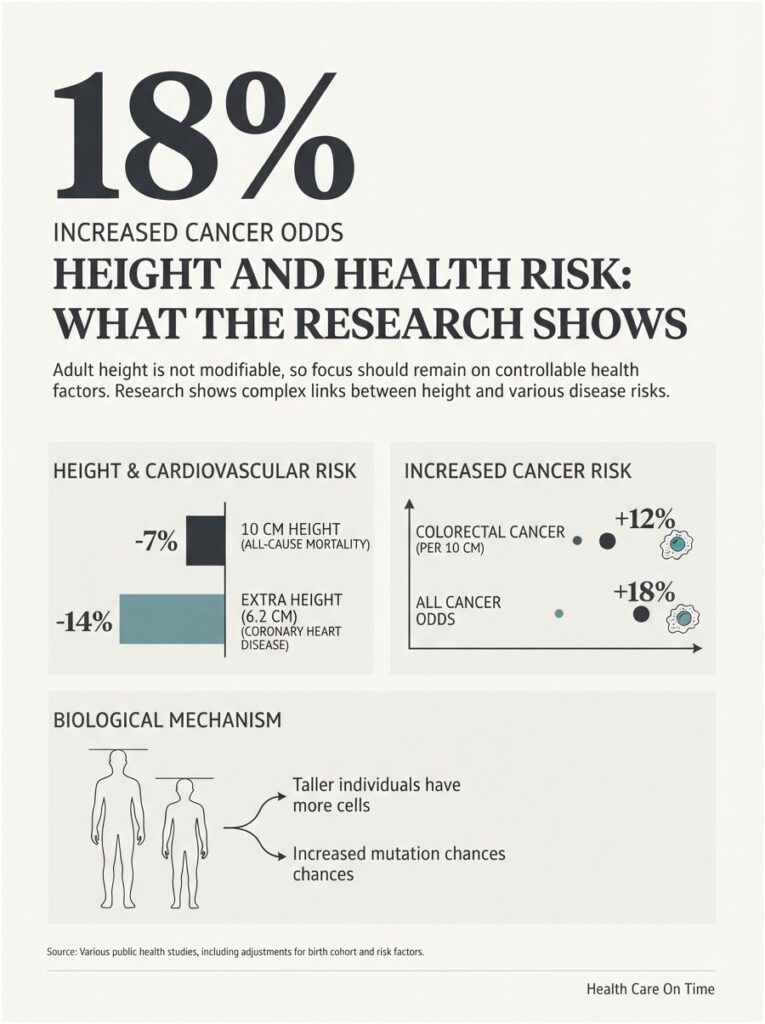
Taller adults have modestly lower cardiovascular risk in most large studies. In a 21-country cohort of more than 154,000 people, each 10 cm of additional height was associated with a hazard ratio of 0.93 for all-cause mortality after adjustment.
A within-sibling Mendelian randomization analysis estimated that one standard deviation of extra height, about 6.2 cm in women, lowered the odds of coronary heart disease by 14 percent, with a confidence interval running from 3 to 23 percent.
The Cancer Findings
The direction reverses for cancer. The same sibling analysis found one standard deviation of extra height raised cancer odds by 18 percent, with an interval of 3 to 34 percent.
Meta-analyses of prospective studies put the relative risk of colorectal cancer at 1.12 per 10 cm of height, with narrower effects for lung and prostate cancer.
The leading explanation is simple biology: more cells means more opportunities for a mutation, and taller people carry more cells.
The Evidence Is Less Settled Than It Looks
Both directions come with real caveats. A study of more than 10,000 people in Sardinia found the expected patterns for cardiovascular disease and cancer, but the associations mostly lost significance after adjusting for birth cohort and established risk factors.
Birth cohort is the recurring problem. People born earlier are shorter and also faced different smoking rates, diets, and medical care. Separating height from the era someone grew up in is genuinely hard.
Why This Should Not Change Your Week
These are population-level associations with wide confidence intervals, and adult height is not modifiable. Nothing in this research suggests a shorter or taller woman should screen differently.
Our medical reviewers treat these findings the way most clinicians do: interesting for understanding disease origins, close to useless for individual decisions. Blood pressure, lipids, glucose, activity, and smoking status all move risk far more, and all of them respond to action.
Measuring, Tracking, and Knowing When to Act
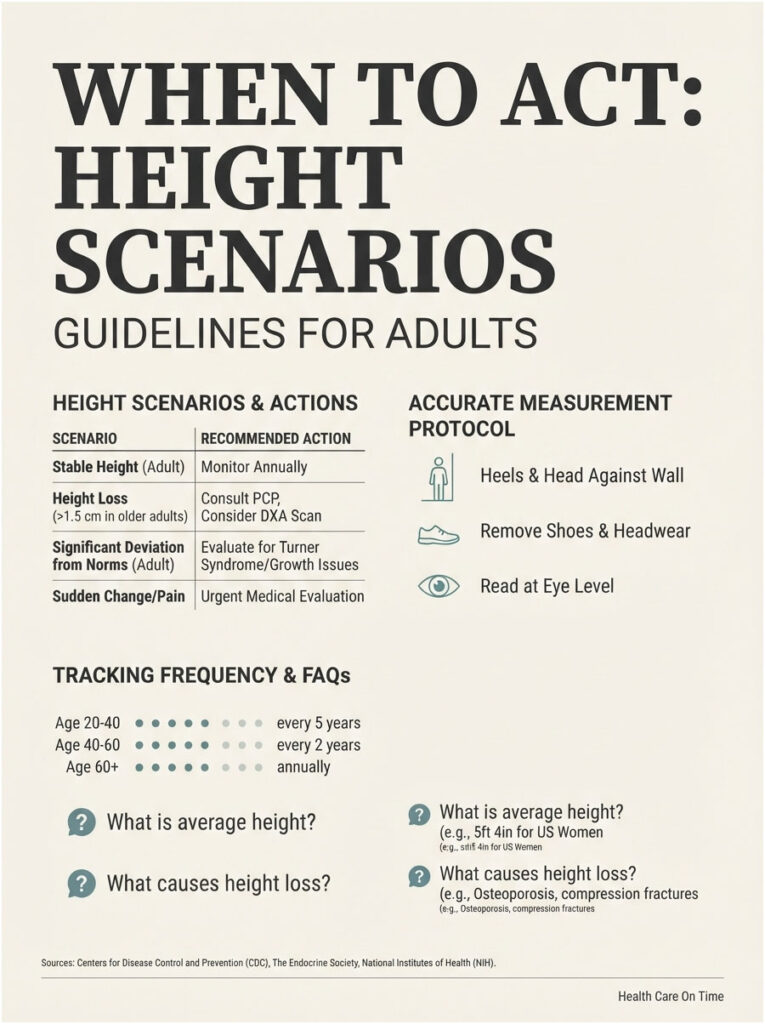
Table 3. Height Scenarios and What to Do
| Scenario | What it may mean | Recommended action |
| Adult height within 2 inches of 63.5 in | Squarely typical, roughly 25th to 75th percentile | No action needed |
| Adult below 58.9 in with short parents | Likely familial short stature | No action unless other symptoms are present |
| Adult below 58.9 in with average-height parents | Possible undiagnosed endocrine or genetic cause | Ask a physician about thyroid, IGF-1, and karyotype testing |
| Girl dropping two percentile bands within 2 years | Growth deceleration worth investigating | Pediatric visit with growth chart review and bone age assessment |
| Girl growing under 2 inches per year before puberty | Below-expected growth velocity | Pediatric endocrinology referral |
| Woman over 50 losing more than 1.5 cm from peak height | Possible early bone density loss | Request a DXA scan plus vitamin D and calcium testing |
| Sudden height loss with new back pain | Possible vertebral compression fracture | Prompt medical evaluation with spine imaging |
General guidance only. Individual thresholds vary and should be set by your clinician.
How to Measure Your Height Correctly
Do it in the morning. Spinal discs compress through the day, and you can lose close to half an inch between waking and bedtime.
Stand barefoot with heels, buttocks, and shoulder blades against a flat wall. Look straight ahead, place a flat object level on top of your head, mark the wall, and measure from the floor.
Common errors that inflate the result: tilting the chin up, standing on carpet, keeping socks on, or angling the flat object downward toward the wall.
What to Track and How Often
For women under 50, an annual height check is enough. After 50, measure yearly and write it down, because the comparison that matters is against your own peak height in early adulthood, not against a chart.
Patients booking bone-health panels with HealthCareOnTime frequently discover their height record is the earliest clue they had. A single number means little. A trend means a lot.
Frequently Asked Questions
What is the average height for a woman in the United States?
The average is 63.5 inches, or 5 feet 3.5 inches (161.3 cm), for women age 20 and older. This comes from CDC measurements collected between August 2021 and August 2023, taken by trained examiners without shoes rather than from self-reported survey answers.
Is 5 feet 2 inches short for a woman?
It’s below average but well within the normal range. At 62 inches you sit near the 30th percentile, meaning about 70 percent of American women are taller. Medically, short stature begins closer to 58 inches, so 5 feet 2 inches carries no clinical significance at all.
Is 5 feet 7 inches tall for a woman?
Yes, by American standards. At 67 inches you’re near the 90th percentile, so roughly nine in ten US women are shorter. It’s still comfortably within the normal range, and in Latvia or the Netherlands it would be close to average.
What is the average height for a 12 year old girl?
Girls aged 12 to 13 average 61.6 inches, or about 5 feet 1.6 inches. This age band sits right in the middle of the pubertal growth spurt, so individual variation is unusually wide. Two healthy 12-year-olds can differ by six inches or more.
At what age do girls stop growing taller?
Most girls reach final adult height between 14 and 16, though some add a small amount until 17. Growth plates close at the end of puberty, typically two to three years after a first period. Federal data shows average height barely changing after age 16.
How do I predict my daughter’s adult height?
Use the mid-parental formula: add both parents’ heights in inches, subtract 5, then divide by two. The result is a midpoint, with most girls landing within about 2 inches on either side. Bone age imaging gives a tighter estimate when a pediatrician needs one.
Can a woman grow taller after 18?
Not naturally. Once the growth plates fuse, the long bones cannot lengthen, and no supplement, stretch, or exercise changes that. Posture work and core strength can help you stand at your full existing height, which sometimes recovers a fraction of an inch.
Why am I getting shorter as I get older?
Two things happen together. Spinal discs lose water and flatten, and bone density declines, particularly after menopause. Loss of a quarter to half an inch per decade after 40 is expected. Faster loss can signal osteoporosis or vertebral compression fractures worth investigating.
How much height do women lose with age?
Federal data shows women averaging 64.4 inches in their twenties and 61.7 inches at 80 and older. Other research puts cumulative loss above three inches by age 80. Some of that gap reflects real shrinkage and some reflects generational differences in adult height.
Does the mother or father determine a daughter’s height?
Both, roughly equally. The mid-parental formula averages the two precisely because neither dominates. Height involves more than 12,000 genetic variants scattered across both parents, which is why sisters raised together can differ by several inches.
Which country has the tallest women?
Latvia and the Netherlands lead, with average female height near 5 feet 6.5 to 5 feet 7 inches. Guatemala records the shortest at roughly 4 feet 11 inches. The gap between tallest and shortest populations has stayed close to 20 cm for a century.
What is considered short stature medically?
Height more than two standard deviations below the average for age and sex, which captures the shortest 2.3 percent of people. For US women that threshold sits near 58 inches. It’s a screening trigger for evaluation, not a diagnosis by itself.
Medical Disclaimer
This article is for educational purposes and does not replace evaluation by a qualified healthcare professional. Population averages describe groups, not individuals, and they are not targets to reach. If you have concerns about your own growth, your child’s growth, unexplained height loss, or how you feel about your body, speak with a physician or a licensed mental health professional.
References
- Anthropometric Reference Data for Children and Adults: United States, August 2021 to August 2023 (NCHS, Vital and Health Statistics Series 3, No. 50)
- Adult female height in inches, NHANES August 2021 to August 2023, Table 8
- Height in inches for children and adolescents, NHANES August 2021 to August 2023, Table 6
- CDC FastStats: Body Measurements
- Anthropometric Reference Data for Children and Adults: United States, 2015 to 2018 (NCHS Series 3, No. 46)
- A century of trends in adult human height, NCD Risk Factor Collaboration, eLife 2016
- Taller height and risk of coronary heart disease and cancer: a within-sibship Mendelian randomization study, eLife 2022
- Variations in the association of height with mortality, cardiovascular disease and cancer, International Journal of Epidemiology
- Association between adult height and risk of colorectal, lung, and prostate cancer
- The association of adult height with the risk of cardiovascular disease and cancer in the population of Sardinia, PLOS One
- Growth Hormone Treatment to Final Height in Turner Syndrome: Systematic Review, Clinical Therapeutics
- Turner Syndrome Foundation: Growth
- Measured parental height in Turner syndrome, a valuable but underused diagnostic tool
- Height Loss Is an Independent Predictor of Fracture Incidence in Postmenopausal Women (Gliwice Osteoporosis Study)
- Prediction model for osteoporotic vertebral compression fracture screening