Americans buy roughly six and a half times more fresh apples than fresh pears every year. Yet the pear quietly beats the apple on the one nutrient that almost no American gets enough of. The gap looks small on a nutrition label and turns out to be surprisingly large in practice.
Table of Contents
Quick Answer: The pear wins by a narrow margin. A medium pear delivers 5.5 grams of fiber against a medium apple’s 4.4, with slightly less total sugar, more potassium, and triple the copper. The apple counters with more vitamin C, more quercetin, and a marginally lower glycemic load. Choose the pear for fiber and regularity, the apple for blood sugar steadiness.
At a Glance
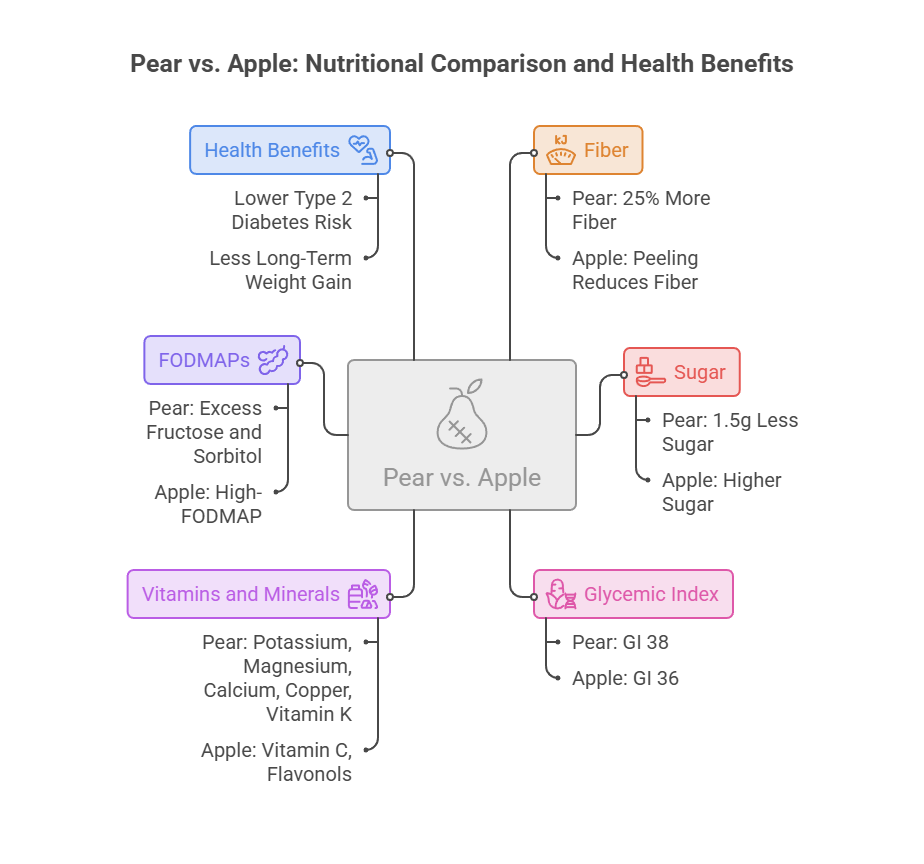
• A medium pear carries about 25% more fiber than a medium apple, and about 1.5 grams less total sugar.
• Both sit in the low glycemic index band (36 for apple, 38 for pear), so neither behaves anything like juice.
• Pears lead on potassium, magnesium, calcium, copper and vitamin K. Apples lead on vitamin C and flavonols such as quercetin.
• Both are high-FODMAP fruits. Pears stack excess fructose and sorbitol together, which is why they upset sensitive guts more often.
• Peeling an apple cuts its fiber roughly in half, erasing the entire difference between the two fruits in one knife stroke.
• Harvard cohort data links apples and pears together to lower type 2 diabetes risk and less long-term weight gain, so the “wrong” pick here is still a good one.
Pear vs Apple: The Short Answer
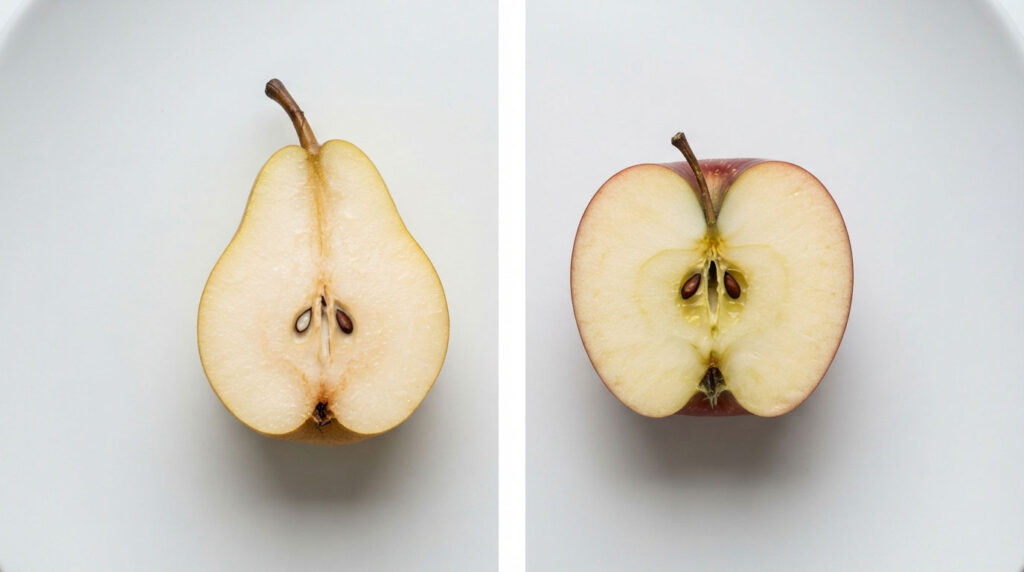
Both fruits belong to the same botanical family and behave almost identically inside the body. They are pomes in the Rosaceae family, with thin edible skin, pale flesh, and a seeded core.
That shared biology explains why the debate never resolves cleanly online. The differences between them are real, but they are differences of degree rather than kind.
What “healthier” means when both options are already good
Any useful comparison needs a yardstick. Calories per fruit is the obvious one, but a six-calorie gap is statistical noise inside a 2,000-calorie day.
The measures that actually move health outcomes are fiber grams, glycemic load, mineral density, and polyphenol profile. Those four carry the rest of this article.
Our medical reviewers keep returning to the same practical filter: pick the fruit that closes your largest nutritional gap. For the overwhelming majority of Americans, that gap is fiber.
The three places they genuinely diverge
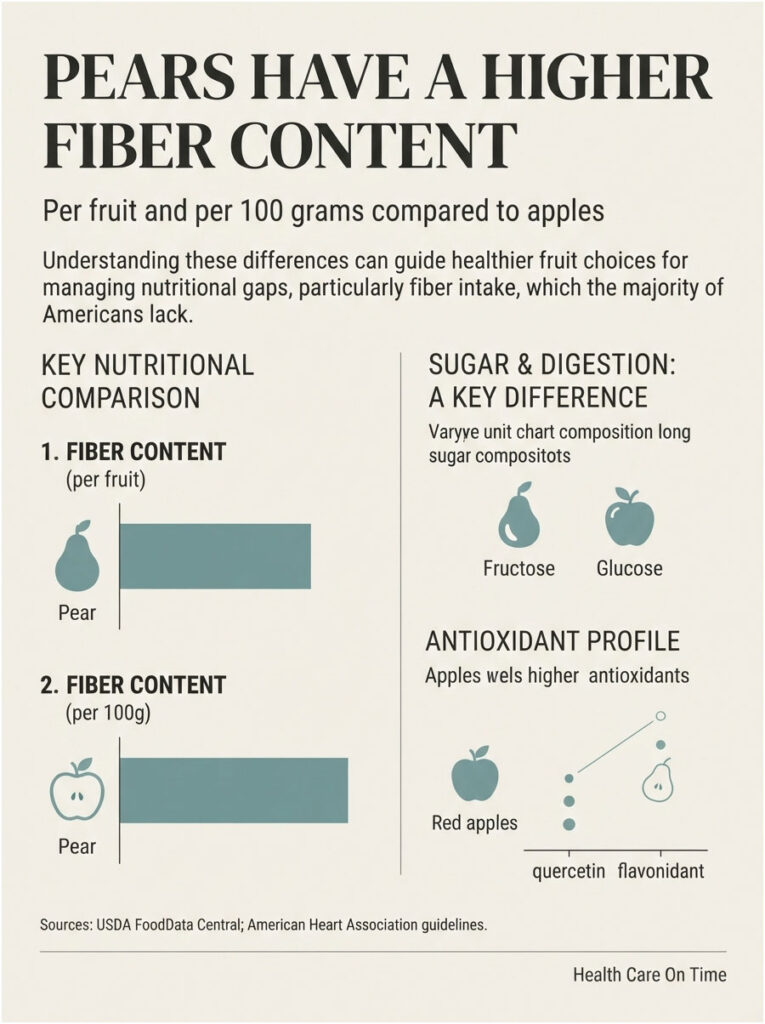
First, fiber. The pear carries more per fruit and more per 100 grams, and the margin survives across every common US variety.
Second, sugar composition. Pears run a higher ratio of fructose to glucose, which matters far more for digestion than for blood sugar.
Third, antioxidant type. Apples, particularly red-skinned varieties, carry more quercetin and related flavonols. Pears carry a smaller, differently structured polyphenol load concentrated in the peel.
Everything else, including water content, protein, and fat, is close enough to call even.
Pear vs Apple Nutrition, Side by Side
Here is the head-to-head using USDA FoodData Central reference values, scaled to the standard US medium fruit sizes sold in American supermarkets.
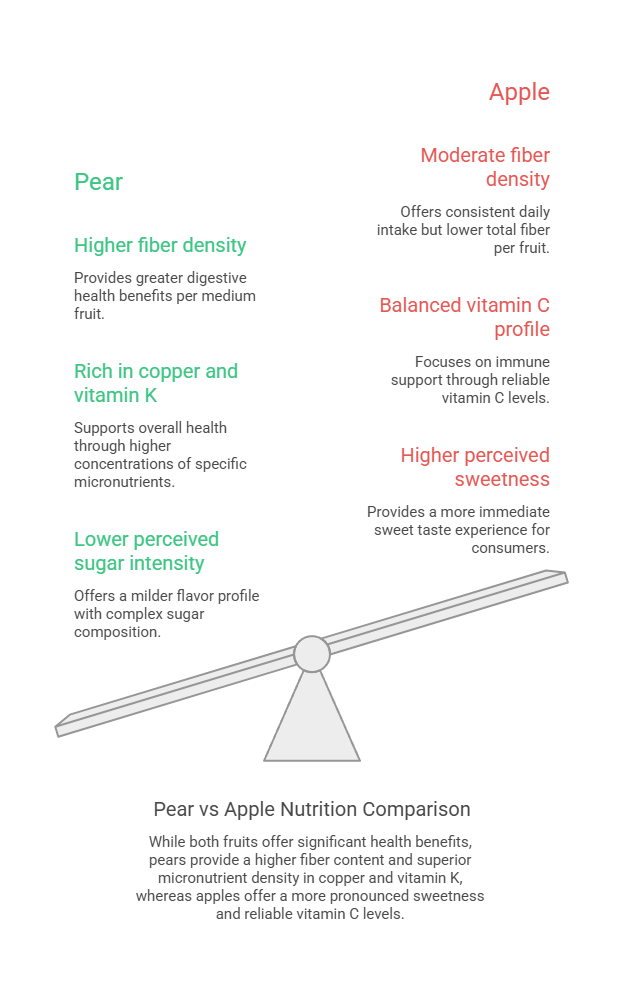
Table 1: Pear vs Apple Nutrition, Per Medium Fruit
| Nutrient (per medium fruit) | Apple, 182 g (3″ diameter) | Pear, 178 g | Difference | Edge |
| Calories | 95 kcal | 101 kcal | Pear +6 kcal | Apple (slight) |
| Dietary fiber | 4.4 g | 5.5 g | Pear +1.1 g (25% more) | Pear |
| Total sugars | 18.9 g | 17.4 g | Pear −1.5 g | Pear |
| Total carbohydrate | 25.1 g | 27.1 g | Pear +2.0 g | Apple (slight) |
| Protein | 0.5 g | 0.6 g | Pear +0.1 g | Tie |
| Potassium | 195 mg | 206 mg | Pear +11 mg | Pear |
| Vitamin C | 8.4 mg | 7.7 mg | Pear −0.7 mg | Apple |
| Vitamin K | 4.0 mcg | 7.8 mcg | Pear +3.8 mcg (95% more) | Pear |
| Copper | 0.05 mg | 0.15 mg | Pear roughly 3x more | Pear |
| Magnesium | 9 mg | 12 mg | Pear +3 mg | Pear |
| Calcium | 11 mg | 16 mg | Pear +5 mg | Pear |
| Water content | About 86% | About 84% | Pear −2 points | Apple (slight) |
| Glycemic index | 36 | 38 | Pear +2 | Apple (slight) |
| Estimated glycemic load | About 7.5 | About 8.2 | Pear +0.7 | Apple (slight) |
Calories and portion reality
The pear looks heavier on the calorie line, and it is, by six calories. That is roughly the energy in two blueberries.
Per 100 grams the apple is leaner, at 52 calories against the pear’s 57. Per whole fruit the gap nearly closes, because a standard medium pear weighs slightly less than a standard medium apple.
Real produce ignores these averages. A jumbo Honeycrisp can reach 130 calories, and a small Seckel pear lands closer to 50. Weigh your usual fruit once, then estimate from there.
Fiber, the biggest measurable gap
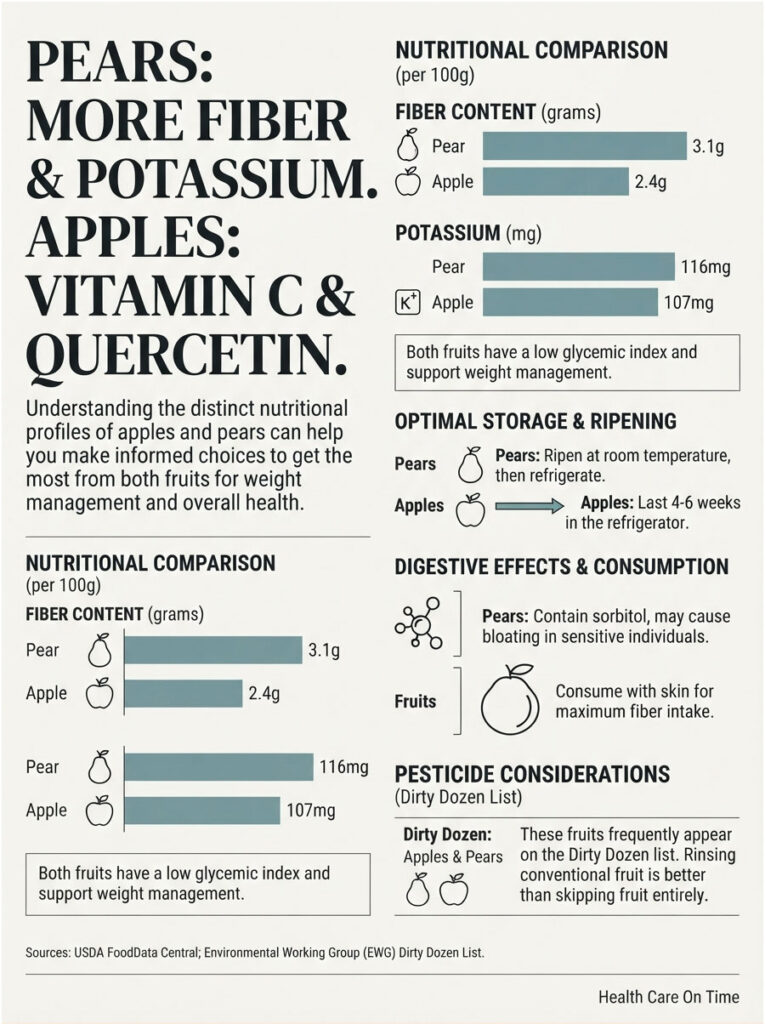
This single line decides the comparison for most readers. The pear supplies 3.1 grams of fiber per 100 grams against the apple’s 2.4.
Scaled to a whole fruit, that is 5.5 grams versus 4.4, or about a fifth of an adult woman’s daily target from one piece of fruit.
Here is why the difference matters more than it looks. National survey data puts average American fiber intake near 16 grams a day against targets of 25 grams for women and 38 for men.
Stanford Medicine reports that only about 5% of US adults hit the recommended amount. Federal dietary guidance flags fiber as a nutrient of public health concern for exactly this reason.
Against a shortfall of roughly 9 to 20 grams, an extra 1.1 grams from a single fruit swap is not trivial. Repeated daily, it closes more than a tenth of the average woman’s gap on its own.
Patients booking metabolic panels through HealthCareOnTime often treat fiber as a digestion-only nutrient. The lab markers tell a wider story, touching glucose control and lipid numbers at the same time.
Sugar, fructose, and the sweetness illusion
Pears taste sweeter than most apples, so shoppers assume they carry more sugar. Per fruit, the opposite is true.
A medium pear holds about 17.4 grams of total sugar. A medium apple holds about 18.9 grams.
The reason for the taste gap is chemistry, not quantity. Roughly two-thirds of a pear’s sugar is fructose, which registers as sweeter on the tongue than glucose or sucrose at identical weight.
Apples split their sugar more evenly across fructose, glucose and sucrose. Less perceived sweetness, marginally more total grams.
Vitamins and minerals, who wins what
Neither fruit is a vitamin powerhouse. Both are mid-tier on micronutrients and excellent on fiber relative to calories.
Vitamin C, quercetin, and the apple’s antioxidant edge
Apples carry slightly more vitamin C, though at 8.4 mg per fruit that is under 10% of the daily value. Nobody should be eating apples for vitamin C.
The apple’s real chemical advantage is quercetin, a flavonol concentrated in the skin and most abundant in red varieties such as Red Delicious, Fuji and Gala. Quercetin has been studied for blood pressure and inflammatory markers.
Granny Smith and other green varieties carry less quercetin and fewer anthocyanins, but land at the low end of the calorie range. Skin color works as a rough proxy for polyphenol load.
Copper, vitamin K, and the pear’s quiet advantages
The pear takes the mineral column outright: more potassium, magnesium, calcium, and about three times the copper at 0.15 mg per fruit against the apple’s 0.05 mg.
Copper is genuinely uncommon in fruit and supports iron metabolism and connective tissue. A medium pear covers close to 16% of the daily value.
Vitamin K shows the largest proportional gap. A medium pear supplies nearly double the apple’s amount, which matters for anyone on warfarin who needs consistent daily intake.
Pears also contribute small amounts of folate that apples largely lack. None of these is dramatic alone, but they stack in one direction.
Our nutrition reviewers see this pattern repeatedly across fruit comparisons: the item with the higher fiber count usually carries the better mineral profile too, because both concentrate in the same tissues.
Blood Sugar, Glycemic Index, and Diabetes Risk
This is where the comparison turns practical for the tens of millions of Americans managing prediabetes or type 2 diabetes.
GI 36 versus GI 38, and why glycemic load matters more
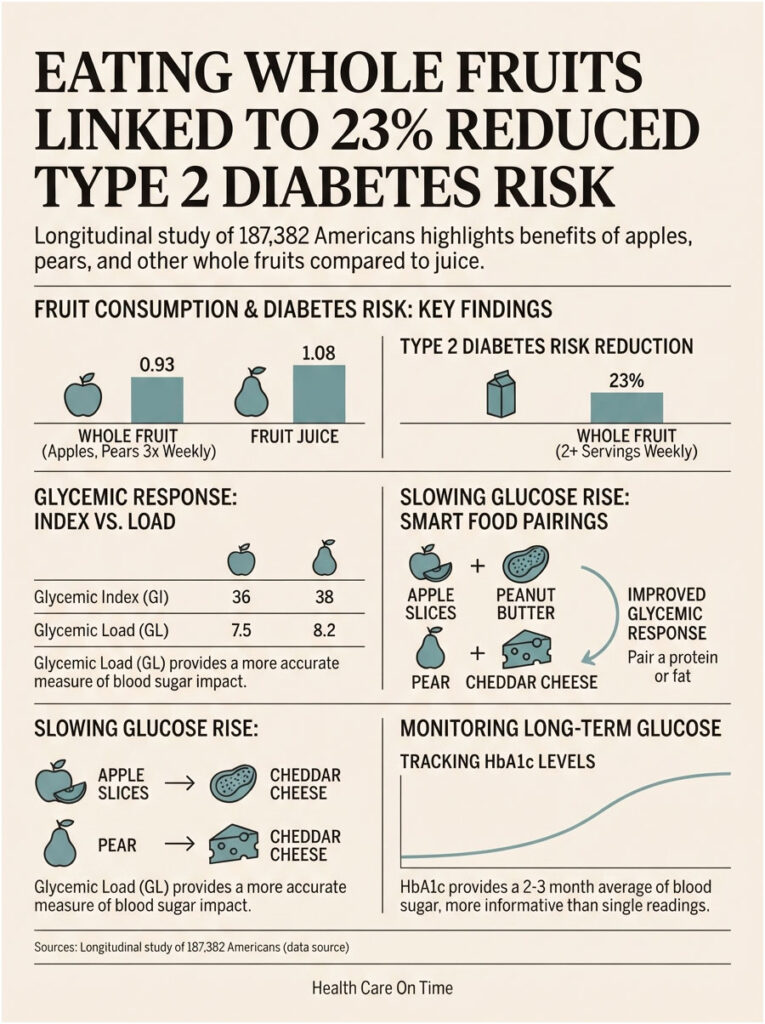
Apples score a glycemic index of 36. Pears score 38. Both fall well inside the low band, which cuts off at 55.
A two-point difference sits inside the margin of error for glycemic index testing. Ripeness, variety, and even storage time shift these numbers more than the choice of fruit does.
Glycemic load is the more useful figure because it accounts for portion size. A medium apple lands near 7.5 and a medium pear near 8.2, both classified low.
The practical translation: neither fruit is a blood sugar problem when eaten whole. The apple’s advantage is real but small enough that fiber content probably deserves to outrank it in your decision.
What 187,382 Americans over 24 years actually showed
The strongest evidence available comes from three long-running US cohorts, pooled in a 2013 BMJ analysis from the Harvard T.H. Chan School of Public Health.
Researchers followed the Nurses’ Health Study, Nurses’ Health Study II and the Health Professionals Follow-up Study from 1984 to 2008. Just over 12,000 participants developed type 2 diabetes during that window.
Apples and pears, grouped together, returned a pooled hazard ratio of 0.93 for every three servings per week. Blueberries performed best at 0.74.
The Harvard summary noted that eating at least two weekly servings of certain whole fruits was associated with a risk reduction of up to 23%.
That the researchers combined apples and pears into a single food category is itself informative. Investigators with detailed food-frequency data judged the two fruits nutritionally close enough to treat as one.
Whole fruit versus juice, the split that reverses the benefit
The same analysis found fruit juice moving in the opposite direction, with a hazard ratio of 1.08 per three servings per week.
Apple juice is not a smaller apple. Removing the pulp removes nearly all the fiber and leaves behind a fast-absorbing sugar solution.
This distinction matters more for apples than for pears in the American diet. USDA figures put juice at roughly 43% of total US apple availability, which means a large share of the country’s apple intake carries none of the fruit’s advantages.
Across the fasting glucose panels processed through our diagnostic network, the daily juice habit is one of the most common blind spots patients report once they review their intake honestly.
What to pair each fruit with to flatten the curve
Eating either fruit alongside protein or fat slows gastric emptying and blunts the glucose rise. This single habit outperforms agonizing over which fruit to buy.
Workable pairings: apple slices with peanut butter, pear with a slice of sharp cheddar, either one folded into plain Greek yogurt with cinnamon.
If you track your own numbers, an HbA1c test shows the three-month pattern far better than any single post-snack glucose reading.
Gut Health, Fiber Type, and Digestion
Fiber grams tell you the quantity. Fiber type tells you what that fiber will actually do once it arrives.
Pectin, sorbitol, and why pears move things along
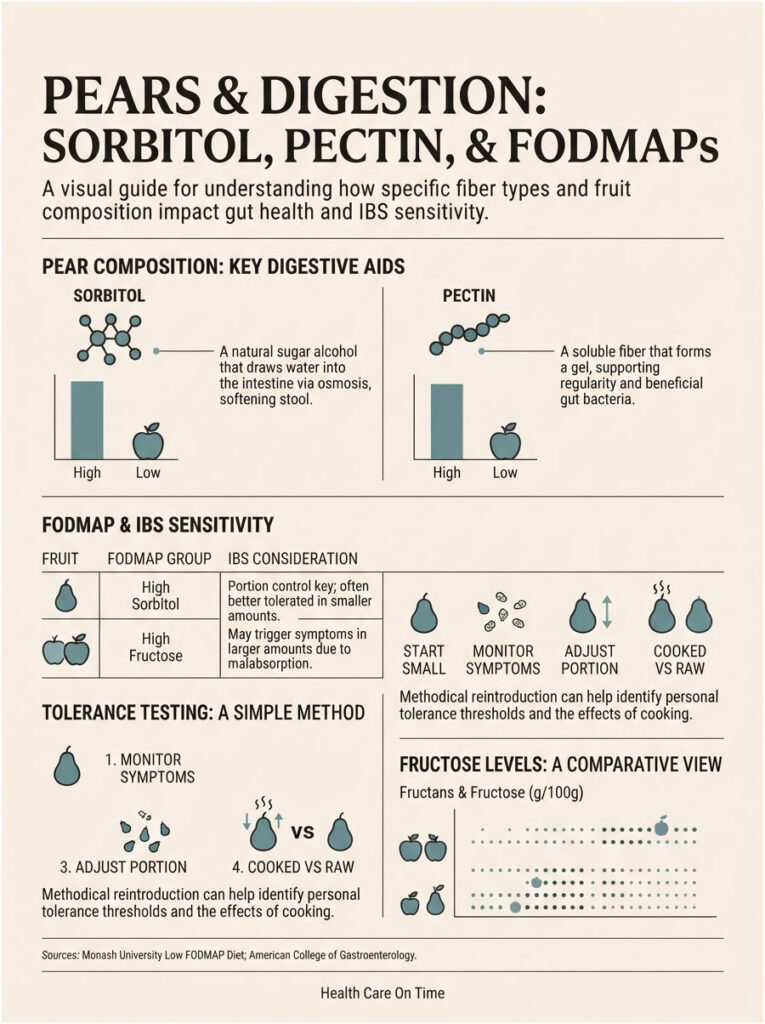
Both fruits are rich in pectin, a soluble fiber that gels in the gut, feeds beneficial bacteria and slows sugar absorption.
Pears add a second mechanism. They carry meaningful amounts of sorbitol, a sugar alcohol that draws water into the colon by osmosis.
That combination of higher total fiber plus an osmotic pull is why pears have earned a stronger reputation for relieving constipation than apples have.
For anyone whose main complaint is irregularity, the pear is the clearer choice. Pair it with water, since added fiber without added fluid can make the problem worse.
When pears backfire, the FODMAP problem
The same sorbitol that helps a sluggish gut punishes a sensitive one. Monash University, which operates the reference laboratory for FODMAP testing, lists fructose and sorbitol as the main FODMAPs in pears.
Both fruits are classified high-FODMAP. Apples carry excess fructose and sorbitol as well, so this is not a pear-only problem.
The difference is stacking. Pears tend to deliver a heavier combined load in one sitting, which is why they appear more often on named IBS trigger lists.
If you have irritable bowel syndrome, a smaller portion of either fruit beats eliminating both. A quarter to half a fruit, eaten away from other trigger foods, teaches you more than total avoidance does.
Patients commonly ask our reviewers whether cooking helps. Baking or poaching softens texture and improves tolerance for some people, but it does not meaningfully reduce FODMAP content.
The apple’s fructose issue
Apples also carry more fructose than glucose, though the ratio is less lopsided than the pear’s at roughly 57% against 66%.
For people with fructose malabsorption, apples can produce the same bloating and gas that pears do. Individual tolerance varies far more widely than any published food list suggests.
A simple tolerance test you can run in two weeks
Eat half a fruit, alone, mid-morning, on three separate days. Note any symptoms at the two-hour and six-hour marks.
Repeat with the other fruit the following week. Most people find they tolerate one noticeably better, and the answer is not always the one the charts predict.
Heart Health, Cholesterol, and Weight Control
Cardiovascular benefit is where these two fruits look most alike, and where the combined evidence base is strongest.
Soluble fiber and LDL cholesterol
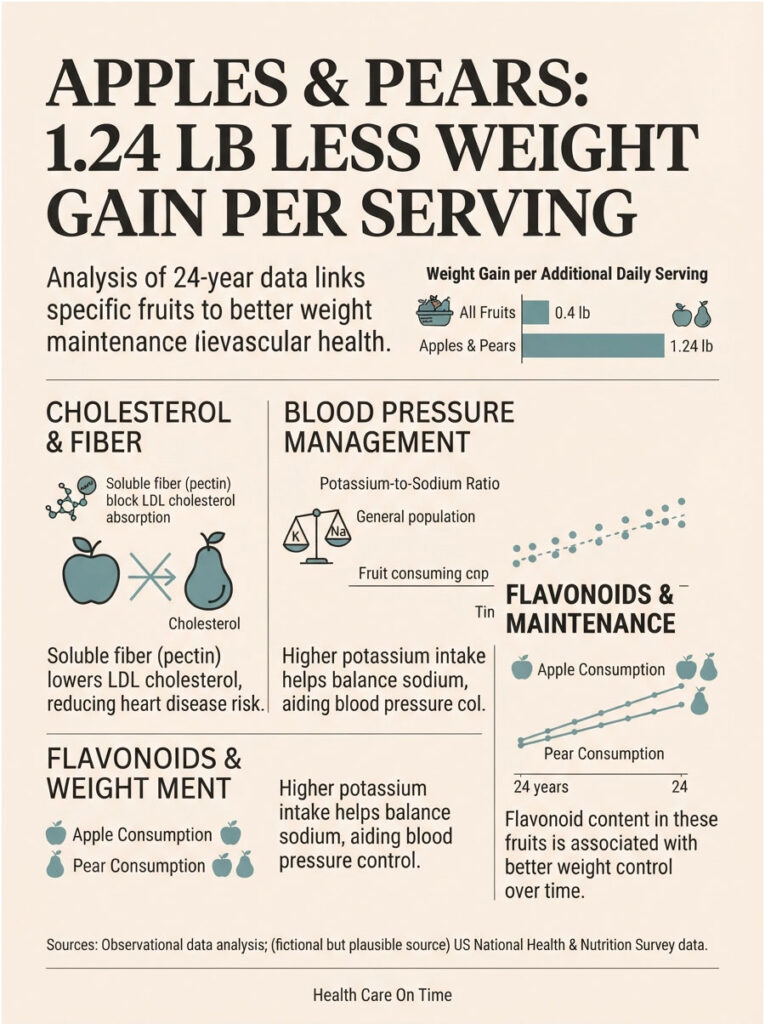
Pectin binds bile acids in the small intestine. The liver then pulls cholesterol out of circulation to manufacture replacement bile acids, which nudges LDL downward.
Both fruits supply pectin. The pear supplies more total fiber, though the soluble fraction specifically is comparable between them.
A 2019 systematic review and meta-analysis of apples, pears and their products found a significant association with cardiovascular outcomes across cohort studies, plus a BMI reduction with apple intake in randomized trials.
The same review found no significant change in serum lipid concentrations from apple intake specifically. An honest reading: the cardiovascular signal is real, while the cholesterol mechanism is less proven than most popular articles imply.
Potassium, sodium balance, and blood pressure
Potassium helps the kidneys clear sodium and relaxes blood vessel walls. Most American adults fall short of the recommended intake.
The pear’s 206 mg per fruit edges the apple’s 195 mg, though both are modest against a 3,400 mg daily target. A single banana carries more than double either one.
Where fruit helps blood pressure is cumulative. Two pieces a day replacing a processed snack shifts the potassium-to-sodium ratio in the right direction over months, not days.
If hypertension or cholesterol is your concern, a lipid profile test gives context that food choices alone cannot supply.
The 24-year weight-change finding
The most quotable evidence on fruit and body weight comes from a 2015 PLOS Medicine analysis of the same three Harvard cohorts.
Increased fruit intake tracked with less four-year weight gain across the board. Apples and pears, grouped together again, showed the strongest association of any fruit category at 1.24 pounds less gain per added daily serving.
Berries came second at 1.11 pounds. Total fruit averaged 0.53 pounds.
A companion flavonoid analysis of 124,086 US adults found flavonols, anthocyanins and flavonoid polymers each linked to better weight maintenance across 24 years of follow-up.
These are observational findings, not proof of cause. People who eat more apples and pears differ from people who do not in dozens of ways no statistical model fully adjusts for.
Table 2: Pear vs Apple, the USA Data Behind the Claims
| Finding | Figure | Population and Period | Source |
| Average daily fiber intake, US adults | About 16 g against targets of 25 g (women) and 38 g (men) | NHANES, What We Eat in America | USDA / NCBI Bookshelf |
| US adults meeting the fiber recommendation | About 5% | US adults, recent NHANES analyses | Stanford Medicine |
| Total apple availability per person | 41.3 lb fresh farm-weight basis, with juice at 43% and fresh apples at 41% (about 17 lb) | Marketing year 2024/25 | USDA Economic Research Service |
| Fresh pear availability per person | 2.6 lb, down almost 4% year over year | Marketing year 2023/24 | USDA Economic Research Service |
| Type 2 diabetes risk, apples and pears | Pooled hazard ratio 0.93 per 3 servings per week | 187,382 US health professionals, 1984 to 2008 | BMJ, 2013 |
| Type 2 diabetes risk, fruit juice | Pooled hazard ratio 1.08 per 3 servings per week | Same three cohorts | BMJ, 2013 |
| Four-year weight change, apples and pears | 1.24 lb less gain per added daily serving | 133,000+ US adults, up to 24 years | PLOS Medicine, 2015 |
| Pesticide residue ranking | Apples 8th, pears 10th on the 2026 Dirty Dozen | 54,344 USDA samples across 47 crops | Environmental Working Group, 2026 |
| Fiber lost when an apple is peeled | 2.4 g falls to 1.3 g per 100 g, a 46% reduction | USDA reference values | USDA FoodData Central |
What Americans Actually Buy, and What It Costs
The nutrition debate stays academic if one fruit never makes it into the cart.
Apple dominance versus the pear’s slow decline
USDA’s Fruit and Tree Nuts Outlook put total apple availability at 41.3 pounds per person in marketing year 2024/25, with fresh apples accounting for about 41% of that, or roughly 17 pounds.
Fresh pear availability came in at 2.6 pounds per person and has been drifting downward for years. Fresh apple to fresh pear, that is about a six-and-a-half-to-one ratio.
The gap has nothing to do with nutrition. It reflects shelf life, bruising, and the fact that most Americans have never eaten a pear at genuine peak ripeness.
Fiber per pound, the honest cost comparison
Retail price data for individual fruits is patchy, since the federal per-pound apple series was discontinued years ago. USDA’s March 2026 outlook does note that grower prices for apples and pears both ran lower in early 2026 than a year earlier.
A cleaner way to compare value is fiber per pound purchased. One pound of pears delivers about 14.1 grams of fiber. One pound of apples delivers about 10.9 grams.
That gives the pear roughly 29% more fiber per pound. The practical rule: if pears cost less than 29% more per pound than apples at your store, they are the better fiber buy that week.
If pears cost more than that premium, apples win on value. That single calculation resolves most produce-aisle hesitation faster than any nutrient chart.
Pesticide residue and how much it should change your choice
Both fruits appear on the Environmental Working Group’s 2026 Shopper’s Guide, which analyzed 54,344 USDA test samples across 47 crops.
Apples ranked eighth and pears tenth on the Dirty Dozen list. CNN’s coverage noted that the 2026 edition added PFAS residue data for the first time.
EWG states plainly that its goal is not to discourage produce consumption. Independent risk assessments generally place typical dietary exposure well below thresholds linked to measurable harm.
The practical read: this factor does not favor one fruit over the other. Rinse both under running water for 30 seconds, and buy organic if the budget allows it.
Which One Should You Pick? A Scenario Guide
Table 3: Pear vs Apple, Match the Fruit to Your Situation
| Your Situation | Better Pick | Why | How to Eat It |
| Chronic constipation or a low-fiber diet | Pear | 25% more fiber plus sorbitol, which pulls water into the colon | One ripe pear with skin, mid-afternoon, with 8 oz of water |
| Prediabetes or type 2 diabetes | Apple (slight edge) | Marginally lower glycemic load and fewer carbohydrate grams per fruit | Half an apple with 1 oz of almonds or 2 tbsp of peanut butter |
| IBS, bloating, or a sensitive gut | Apple, small portion | Both are high-FODMAP, but pears stack excess fructose and sorbitol together | Quarter to half an apple, away from other trigger foods |
| Blood pressure management | Pear | More potassium, magnesium and calcium per fruit | Sliced into plain Greek yogurt at breakfast |
| Weight loss or appetite control | Either, whole and unpeeled | Cohort data links both to less long-term weight gain | Eaten 20 to 30 minutes before a meal |
| Post-workout snack | Apple | Travels better, bruises less, slightly faster carbohydrate delivery | Whole, with a handful of salted nuts |
| Feeding a toddler or an older adult with chewing difficulty | Pear | Softer flesh when ripe, lower choking risk | Peeled and diced, or lightly poached with no added sugar |
| Taking warfarin or other vitamin K sensitive therapy | Apple | The pear carries nearly double the vitamin K per fruit | Keep intake steady rather than switching abruptly, and ask your prescriber |
| Tight grocery budget | Apple, usually | Longer refrigerated shelf life and fewer losses to bruising | Buy by the bag and store in the crisper, not on the counter |
| Concerned about pesticide residue | Either, washed | Both sit on the 2026 Dirty Dozen, so organic is the only real fix | Rinse 30 seconds under running water |
Four mistakes that cancel most of the benefit
Peeling
This is the big one. Removing an apple’s skin drops fiber from 2.4 grams per 100 grams to 1.3, cutting it nearly in half.
Potassium and vitamin E fall sharply at the same time. A peeled pear loses roughly a third of its fiber and a large share of its polyphenols.
Peel either fruit and you have discarded the reason you chose it over a cookie.
Juicing
Covered above, and worth repeating because it is the most common error in the American diet. Whole fruit and fruit juice pull in opposite directions inside the same dataset.
Portion drift with jumbo fruit
Supermarket apples have grown. A large Honeycrisp can weigh 250 grams, pushing 130 calories and 26 grams of sugar.
The USDA medium figures assume 182 grams. If your fruit is visibly bigger than a tennis ball, adjust the numbers upward.
Eating fruit alone on an empty stomach
Fruit by itself digests quickly. Adding 5 to 10 grams of protein or fat slows absorption and extends fullness by an hour or more.
Our reviewers hear this complaint weekly: a piece of fruit at 10 a.m. leaves someone hungrier at 11 than they were before eating. Pairing solves it almost every time.
How to Get the Most From Both Fruits
Ripeness and variety selection
Pears ripen after harvest, not on the tree, which is why so many Americans have only eaten hard ones. Check the neck near the stem, and if it yields to gentle thumb pressure, it is ready.
Bartlett pears shift from green to yellow as they ripen. Bosc and Anjou hold their color, so the neck test matters far more with those two.
For apples, variety shifts the numbers modestly. Granny Smith runs leanest at about 52 calories per 100 grams, Fuji richest near 63, with fiber ranging from roughly 2.1 to 2.8 grams across common cultivars.
Pairings that stretch satiety
Apple with sharp cheddar. Pear with walnuts and a crumble of blue cheese. Either one with cottage cheese and a shake of cinnamon.
Cinnamon is not a gimmick here. It adds perceived sweetness without sugar, which helps considerably if you are cutting back.
Storage that protects the polyphenols
Both fruits hold their nutrients best cold. Apples keep four to six weeks in a refrigerator crisper and only days on a counter.
Pears should ripen at room temperature, then move to the refrigerator to hold. Once cut, a squeeze of lemon slows browning, which is oxidation of the same polyphenols you bought the fruit for.
Frequently Asked Questions
Which is healthier overall, a pear or an apple?
The pear, by a narrow margin. It delivers more fiber, less total sugar, and more potassium, magnesium, calcium, copper and vitamin K per fruit. The apple counters with more vitamin C, more quercetin, and a slightly lower glycemic load. The gap between them is far smaller than the gap between eating fruit and skipping it.
Which has more fiber, an apple or a pear?
The pear. It supplies 3.1 grams of fiber per 100 grams against the apple’s 2.4. Scaled to a whole fruit, a medium pear gives about 5.5 grams while a medium apple gives about 4.4. That is roughly 25% more, and the margin holds across common US varieties.
Which has more sugar, a pear or an apple?
The apple, slightly. A medium apple carries about 18.9 grams of total sugar against the pear’s 17.4. Pears taste sweeter because roughly two-thirds of their sugar is fructose, which registers as sweeter on the tongue than glucose or sucrose at the same weight.
Is a pear better than an apple for diabetes?
The apple holds a small edge, with a glycemic index of 36 against the pear’s 38 and slightly fewer carbohydrate grams per fruit. Both sit in the low glycemic range. Harvard cohort data grouped apples and pears together and linked both to lower type 2 diabetes risk. Discuss portion targets with your provider.
Can I eat a pear every day instead of an apple?
Yes. A daily pear delivers more fiber, potassium and copper than a daily apple at comparable calories. The old saying favors apples for the rhyme, not the evidence. If you tolerate pears without bloating, a daily pear is at least as good a habit.
Which fruit is better for constipation?
The pear, clearly. It carries more total fiber plus a meaningful dose of sorbitol, a sugar alcohol that draws water into the colon and softens stool. Eat it ripe with the skin on, and drink water alongside it. Fiber without adequate fluid can worsen constipation rather than relieve it.
Why do pears make me bloated but apples do not?
Pears combine excess fructose with sorbitol, two poorly absorbed carbohydrates that ferment in the colon and produce gas. Monash University lists both as the main FODMAPs in pears. Apples contain them too, usually in a lighter combined load. Tolerance varies widely, so test small portions rather than eliminating fruit.
Should I eat the skin on both fruits?
Yes, whenever possible. Peeling an apple cuts its fiber from 2.4 grams per 100 grams to 1.3, a 46% loss, and strips most of its vitamin E and quercetin. A peeled pear loses roughly a third of its fiber. Wash the skin thoroughly rather than removing it.
Is a pear or apple better for weight loss?
Roughly equal, and both perform well. A 24-year Harvard analysis found apples and pears together linked to 1.24 pounds less weight gain per added daily serving, the strongest result of any fruit category. Choose whichever one you will eat consistently, keep the skin on, and pair it with protein.
Which fruit is better for lowering cholesterol?
Both supply pectin, a soluble fiber that binds bile acids and nudges LDL downward. The pear carries more total fiber. A 2019 meta-analysis found cardiovascular benefits from apple and pear intake in cohort studies, though it did not find significant changes in serum lipids from apples in randomized trials.
Do apples or pears spike blood sugar more?
Neither spikes blood sugar much when eaten whole. Apples score 36 on the glycemic index and pears 38, both well inside the low band. Estimated glycemic loads are about 7.5 and 8.2 respectively. Juice is a different matter, since removing the fiber turns either fruit into fast-absorbing sugar.
Are organic apples and pears worth the extra cost?
Both appear on the Environmental Working Group’s 2026 Dirty Dozen list, apples eighth and pears tenth, based on 54,344 USDA test samples. Organic is the only reliable way to reduce residue. If the budget is tight, conventional produce rinsed under running water still beats skipping fruit entirely.
Medical Disclaimer: This article is for general information and is not a substitute for professional medical advice, diagnosis or treatment. Nutrient needs, glycemic response and digestive tolerance vary between individuals. If you manage diabetes, kidney disease, irritable bowel syndrome, or take anticoagulant medication such as warfarin, speak with your physician or a registered dietitian before making significant dietary changes. Always seek the guidance of a qualified health provider with any questions about a medical condition.
References
- USDA FoodData Central, nutrient reference values for raw apples and pears
- USDA Economic Research Service, Fruit and Tree Nuts Outlook, March 2026
- USDA Economic Research Service, Food Availability (Per Capita) Data System
- Fiber intake of the U.S. population, What We Eat in America, NHANES
- Stanford Medicine, what nutrition researchers want you to know about fiber
- Muraki et al., fruit consumption and risk of type 2 diabetes, BMJ 2013
- Harvard Gazette, whole fruit and type 2 diabetes risk
- Bertoia et al., fruit and vegetable intake and weight change, PLOS Medicine 2015
- Bertoia et al., dietary flavonoid intake and weight maintenance, 24-year cohorts
- Apples, pears and cardiometabolic risk factors, systematic review and meta-analysis
- Monash University FODMAP program, high and low FODMAP food list
- Environmental Working Group, 2026 Shopper’s Guide to Pesticides in Produce
- CNN, 2026 Dirty Dozen produce rankings
- Cleveland Clinic, daily fiber recommendations by age and sex