Two American adults walk into the same clinic on the same morning. Both measure 5-foot-8, both weigh 175 pounds, both get the same BMI of 26.6, and both get labeled overweight. One will develop type 2 diabetes within a decade. The other will not come close. Their BMI could not tell them apart, and a 60-second measurement could have.
Table of Contents
Quick Answer
BMI compares your weight to your height and nothing else. It cannot tell muscle from fat, cannot see where fat is stored, and was built from 19th-century European male data. It works reasonably at population scale and poorly for judging one person. Waist circumference, waist-to-height ratio, body fat percentage, and metabolic blood markers give a far more accurate picture of your real health risk.
You have probably had the experience. Someone plugs two numbers into a calculator, a category appears next to your name, and it feels official.
Understanding what that category rests on changes how much weight you give it. Our medical reviewers see the same pattern week after week: patients who feel fine and get flagged as high risk, and patients who feel unwell and get told their numbers look great.
At a Glance
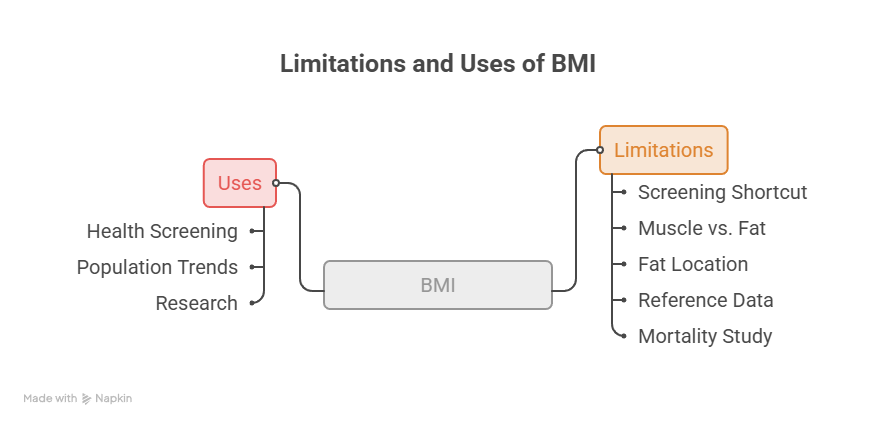
• BMI is a screening shortcut, not a diagnosis, and was never designed to be one
• It cannot separate a pound of muscle from a pound of fat
• It ignores fat location, which is what actually drives disease risk
• Its reference data came from a narrow, mostly white European population
• Directly measured body fat outperformed BMI in a 15-year US mortality study
• A waist under half your height plus clean metabolic labs tells you more than any BMI value
• BMI still has legitimate uses, so the goal is to add to it, not discard it
Two People, One BMI: The Problem in a Snapshot
Return to those two adults from the opening. Same height, same weight, same BMI category. Here is what the tape measure and the blood draw found.
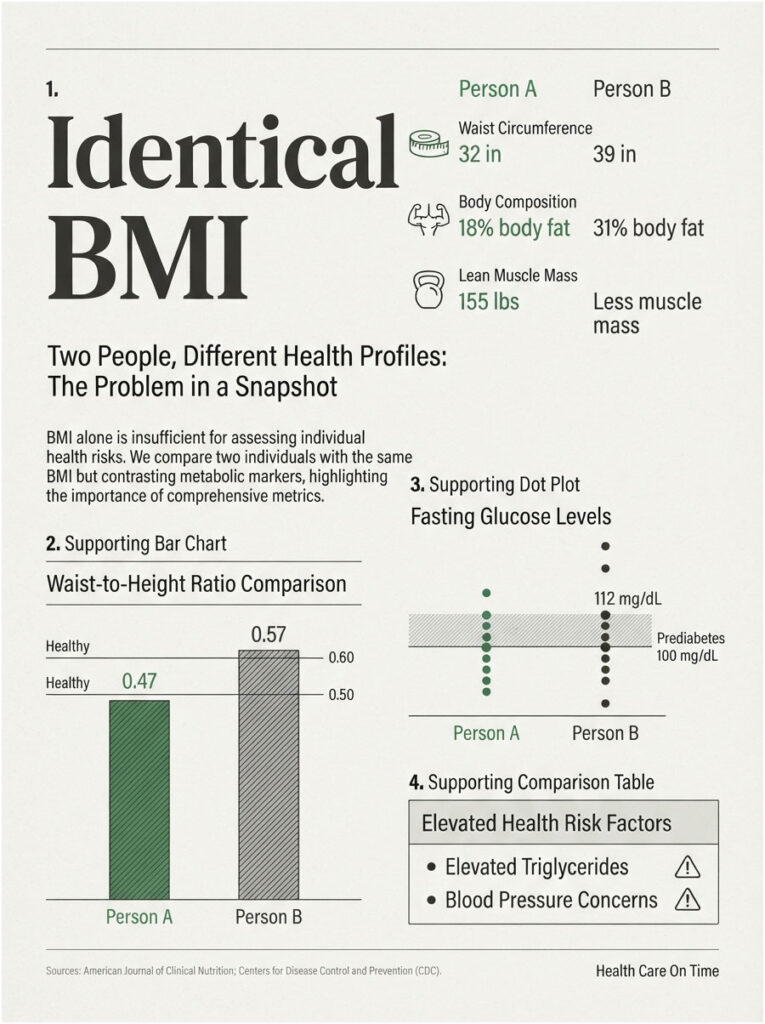
Person A carries a 32-inch waist, roughly 18% body fat, and 155 pounds of lean mass built over years of manual work and weekend basketball. Waist-to-height ratio: 0.47. Fasting glucose, triglycerides, and blood pressure all sit comfortably in range.
Person B carries a 39-inch waist, roughly 31% body fat, and noticeably less muscle. Waist-to-height ratio: 0.57. Fasting glucose is 112 mg/dL, triglycerides are elevated, and blood pressure runs 138/88.
Identical BMI. Opposite risk profiles. In cases reviewed by our medical team, this split shows up so often that BMI alone rarely settles anything.
What BMI Actually Measures (And What It Was Built For)
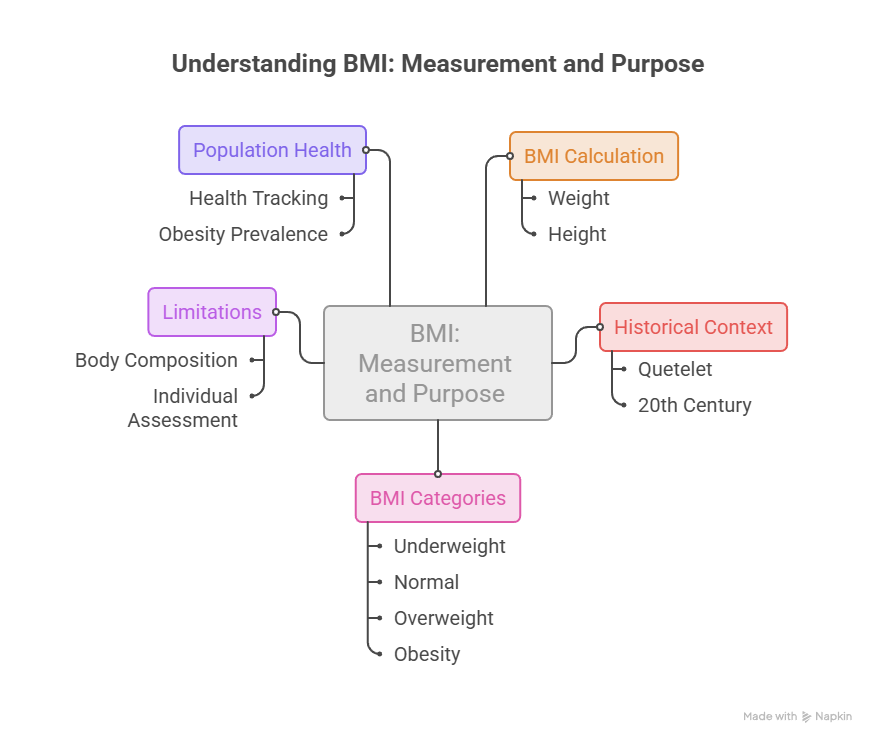
Body mass index is arithmetic, not biology. Take your weight, divide by your height squared, read the result against a chart.
The Formula in Plain English
In US units, the calculation is your weight in pounds divided by your height in inches squared, then multiplied by 703. A 5-foot-9 adult at 180 pounds lands at roughly 26.6.
That single number then decides which box you fall into. Nothing about muscle, bone density, blood pressure, or waistline enters the equation.
A Census Tool, Not a Health Tool
This is the part most patients never hear. The formula came from Lambert Adolphe Jacques Quetelet, a Belgian mathematician who developed it in 1832, and researchers originally used it to describe large groups rather than individual health.
Quetelet was designing a population census in the Netherlands, and his sample consisted of high-income, mostly white men, with the goal of estimating typical body sizes so resources could be distributed. It was demographic bookkeeping, not medicine.
The index acquired the name “body mass index” only in 1972, when American physiologist Ancel Keys applied that label to Quetelet’s formula. Before that, it spread through the mid-20th century largely via insurance actuaries pricing risk across populations.
A metric built by a mathematician for census work, popularized by life insurers, became the front-line health screen in American exam rooms. That history explains nearly every problem that follows.
The Standard Adult BMI Categories
Four categories are in common use: underweight below 18.5, normal from 18.5 to just under 25.0, overweight from 25.0 to just under 30.0, and obesity at 30.0 and above. These cutoffs apply identically to a 22-year-old linebacker and an 80-year-old retiree.
That uniformity is the tool’s whole design and also its central failure. One threshold, applied to every body, regardless of what that body is made of.
Where BMI Genuinely Works Well
Fairness matters, so give the tool its due. BMI is free, instant, needs no equipment beyond a scale and a wall, and produces a number anyone can calculate.
At population scale it earns its place. CDC tracking shows that in 2024 every US state and territory reported adult obesity prevalence of 25% or higher, with the Midwest at 35.9% and the South at 34.5%. That kind of surveillance genuinely directs public health funding.
The catch, as the Lancet Commission put it, is that BMI-based measures can both underestimate and overestimate adiposity and provide inadequate information about health at the individual level. Good for counting a country. Weak for judging a person.
Six Reasons BMI Can Get Your Health Wrong
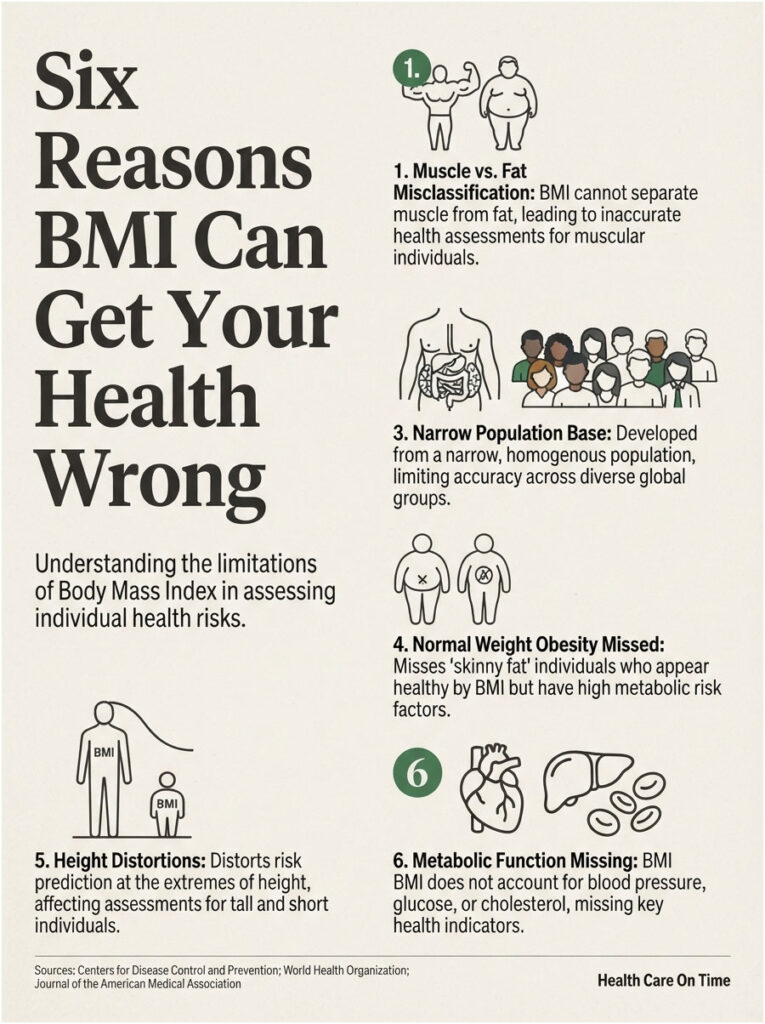
The short version first, then the detail behind each point:
- It cannot separate muscle from fat
- It ignores where fat is stored on your body
- It was built on a narrow, non-representative population
- It misses excess body fat in people who look slim
- It distorts at the extremes of height
- It says nothing about how your metabolism is functioning
1. It Cannot Separate Muscle From Fat
Muscle is considerably denser than fat, and because BMI calculators cannot distinguish the two, people get misclassified routinely. A lean, heavily muscled body weighs more than a soft one of identical size.
The familiar illustrations are athletes: BMI has placed sprinter Usain Bolt near the overweight boundary and NFL quarterback Tom Brady in the obese category. Neither result says anything useful about their health.
This runs the other direction too. Someone who loses 20 pounds of muscle through illness or bed rest watches their BMI fall and may mistake that for progress.
2. It Ignores Where Fat Is Stored
Two people can share a BMI and carry completely different risk depending on fat placement. Fat around the waist raises disease risk more than fat stored elsewhere on the body.
Visceral Fat Versus Subcutaneous Fat
Subcutaneous fat is the layer you can pinch. Visceral fat wraps around your liver, pancreas, and intestines, where it acts less like storage and more like an active endocrine organ.
Abdominal fat is associated with insulin resistance, metabolic disease, and cardiovascular complications, and BMI cannot separate it from fat carried on the hips and thighs. That single blind spot drives a large share of BMI’s failures.
Numerous studies have found that people with identical BMI values carry very different disease risk profiles, primarily because of where their fat sits. The scale reads total mass. Your arteries respond to location.
3. It Was Built on a Narrow Population
BMI was developed from the bodies of non-Hispanic white men, so it may not deliver consistent results across other groups by sex, ethnicity, and race. That is a design constraint, not a debate.
The American Medical Association addressed this in 2023, describing BMI as an imperfect way to measure body fat across multiple groups given that it does not account for differences across racial and ethnic groups, sexes, genders, or age spans.
The practical consequence appears in screening thresholds. Clinical guidance already applies a lower waist cutoff for Asian women, 31.5 inches, versus 35 inches for non-Asian women, because cardiometabolic risk arrives at a smaller body size in some populations.
4. It Misses Normal Weight Obesity
This is the failure mode almost nobody warns patients about. A person can sit at BMI 22, wear a size small, and still carry enough body fat to drive metabolic disease.
Researchers call this normal-weight obesity, and BMI screening misses it entirely, masking serious metabolic and heart disease risk. Many people know it by the informal name: skinny fat.
Patients booking metabolic panels through HealthCareOnTime often fall into exactly this group. Normal weight, normal BMI, and a fasting glucose or triglyceride result that tells a very different story.
5. It Distorts at the Extremes of Height
Because the formula squares height instead of cubing it, very tall people get pushed upward in category and very short people downward. The math flatters one group and penalizes the other.
For someone 6-foot-5 or 4-foot-11, the standard cutoffs carry meaningfully less predictive value. The formula was fitted to average European stature, and it shows.
6. It Says Nothing About Metabolic Function
Your BMI cannot see your blood pressure, your A1c, your triglycerides, your HDL cholesterol, or your inflammatory markers. Those are the variables that actually track disease.
A fuller picture of disease likelihood includes triglycerides, blood pressure, blood glucose, heart rate, inflammation, and stress levels. BMI captures none of them.
People who are lean can be unhealthy, and people with a BMI above 25 can show excellent health markers, which is why obesity medicine specialists say the metric does not reliably predict health at the individual level.
BMI vs the Alternatives, Side by Side
If BMI is a starting point, the obvious next question is what to add. Here is how the realistic options compare for an American adult.
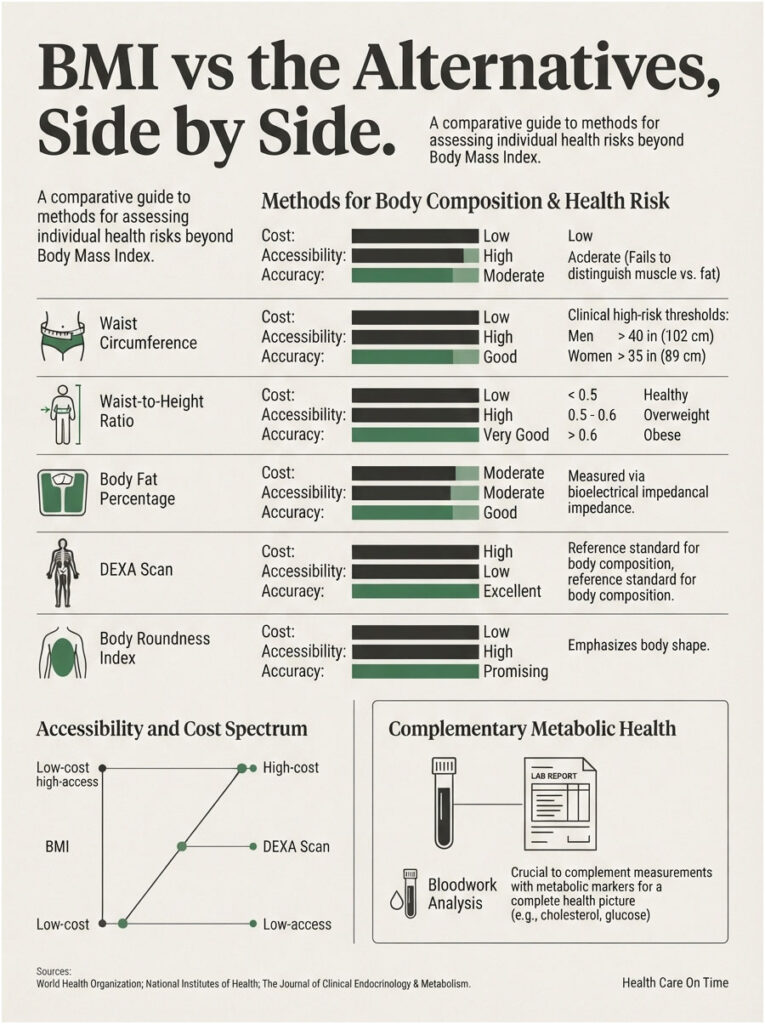
Table 1. BMI compared with the practical alternatives
| Measurement | What It Actually Measures | Typical US Cost and Access | Accuracy for Individual Risk | Best Use For |
| BMI | Weight relative to height squared | Free, any scale and wall | Low for individuals, fair for populations | First-pass screening and population tracking |
| Waist circumference | Abdominal girth, a proxy for visceral fat | Free, a $5 tape measure | Moderate to high | Flagging central adiposity and cardiac risk |
| Waist-to-height ratio | Abdominal girth adjusted for stature | Free, tape measure plus division | High, valid across heights | Simplest reliable at-home screen for adults |
| Body fat percentage (BIA) | Fat mass vs lean mass via electrical current | $0 to $75 at clinics and gyms; devices often under $300 | Moderate to high | Tracking body composition change over time |
| DEXA scan | Fat, lean tissue, and bone by body region | Roughly $50 to $250 out of pocket | Highest available | Reference-standard baseline and regional fat mapping |
| Body roundness index | Body shape derived from waist and height | Free, online calculators | Promising, still being validated | Estimating visceral fat when DEXA is out of reach |
Across the diagnostic network we work with, the pattern holds steady: a tape measure plus a basic blood panel out-predicts BMI at a fraction of the cost of imaging.
Waist Circumference, the 40-Inch and 35-Inch Thresholds
Clinical high-risk thresholds sit above 40 inches for men and above 35 inches for women. For Asian women, guidance tightens to 31.5 inches.
Measure at the level of your navel, standing, at the end of a normal exhale. Do not suck in, and do not pull the tape tight enough to dent skin.
Waist-to-Height Ratio, the Half-Your-Height Rule
This is the most useful free measurement available to most adults. Divide your waist by your height: 0.4 to 0.5 is generally considered healthy, 0.5 to 0.6 suggests increased risk worth attention, and above 0.6 indicates high risk calling for action.
The shorthand is easy to hold onto. Keep your waist under half your height, so a 5-foot-10 adult aims for 35 inches or less.
National clinical guidance in the UK uses the same bands: 0.4 to 0.49 for no increased risk, 0.5 to 0.59 for increased risk, and 0.6 or more for further increased risk. US institutions have moved the same direction, with the Pentagon integrating waist-to-height ratio into body composition standards.
Body Fat Percentage and Bioelectrical Impedance
Bioelectrical impedance analysis sends a small, painless current through the body and estimates fat, lean mass, and water from the resistance it encounters. Fat, muscle, and bone conduct differently.
The American Council on Exercise puts healthy body fat at roughly 21% to 32% for women and 14% to 24% for men. Devices have become affordable enough that many models cost under $300 and now appear in some primary care practices.
Accuracy shifts with hydration, recent meals, and recent exercise. Measure at the same time of day under the same conditions, and read the trend rather than any single number.
DEXA, the Reference Standard
Dual-energy X-ray absorptiometry produces the most detailed breakdown available: fat mass, lean mass, and bone density separated by body region. Research studies validate other methods against it.
The trade-off is access and price. It needs a facility, involves a small radiation dose, and is rarely covered by insurance for body composition alone.
Body Roundness Index, the Newer Contender
BRI uses a mathematical formula relating waist circumference to height, and researchers describe it as promising while noting it still needs validation in further studies.
Values outside the 4.4 to 5.4 range have been associated with increased all-cause mortality. One caution from clinical dietitians: the index still draws on data tables from the early 1970s and still cannot account for muscle.
What Your Bloodwork Adds That No Tape Measure Can
Body shape describes storage. Blood chemistry describes function, and function determines outcomes.
A working metabolic picture includes fasting glucose and HbA1c for glucose control, a lipid profile for triglycerides and HDL, liver enzymes for fatty liver signals, and blood pressure. Together these catch what BMI misses.
Patients often ask our team why someone with an unremarkable BMI would need a metabolic panel. The data in the next section answers that.
What the Newest US Research Says
Evidence against BMI as an individual risk tool has moved fast, and most of the movement happened within the past two years.
The 2025 Mortality Study That Broke BMI’s Last Defense
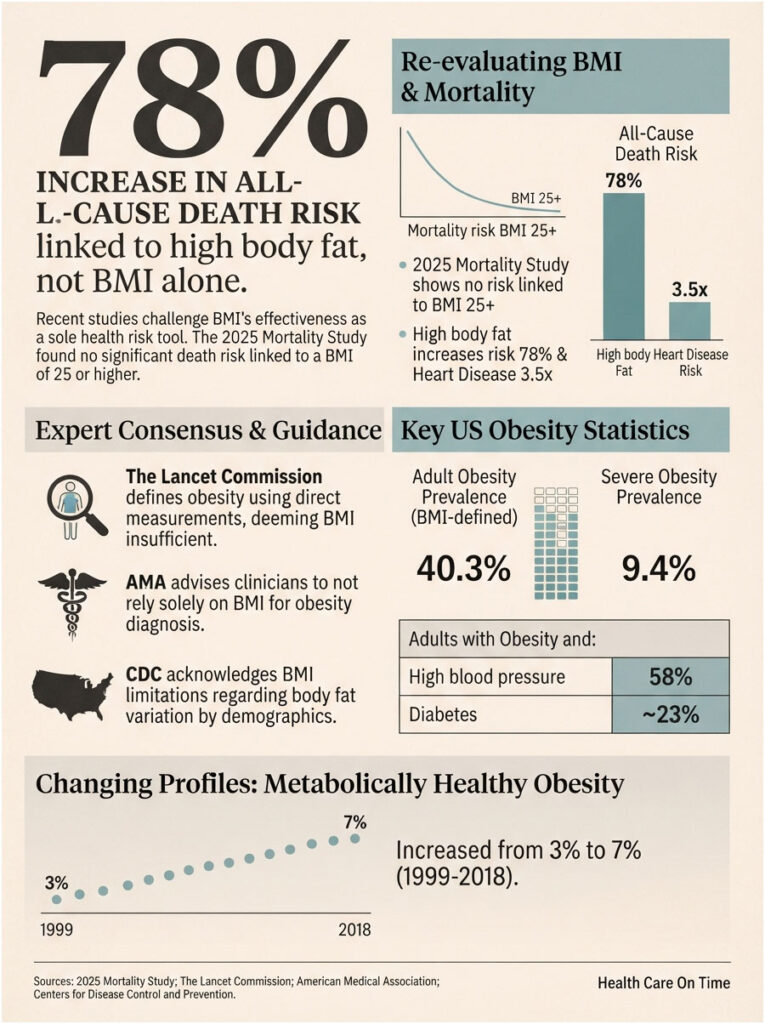
Researchers at the University of Florida analyzed 4,252 participants from the 1999 to 2004 National Health and Nutrition Examination Survey, a nationally representative sample of US adults aged 20 to 49, all with technician-measured body composition data. They tracked mortality across 15 years.
A BMI of 25 or higher showed no statistically significant association with death from any cause compared with the healthy BMI range (hazard ratio 1.25, 95% confidence interval 0.85 to 1.84). The most-used number in American primary care failed to separate who lived from who did not.
Directly measured body fat told a sharply different story: adults with high body fat by bioelectrical impedance were 78% more likely to die of any cause over those 15 years, and roughly three and a half times more likely to die of heart disease.
Waist circumference performed strongly too, with high-waist adults 1.59 times more likely to die of any cause and 4.01 times more likely to die of heart disease. The study appeared in the July 2025 issue of the Annals of Family Medicine.
The Lancet Commission Redefines Obesity
On January 14, 2025, The Lancet Diabetes & Endocrinology published a Commission separating “clinical obesity,” a chronic systemic disease state directly caused by excess adiposity, from “preclinical obesity,” excess adiposity without current organ dysfunction but with elevated future risk.
More than 75 international medical organizations had endorsed it by publication. Under the framework, excess adiposity must be confirmed by direct measurement such as DXA or bioimpedance, or by at least one anthropometric measure in addition to BMI, or by two anthropometric measures regardless of BMI.
Read that closely. Global consensus now treats BMI alone as insufficient to diagnose obesity at all.
Why the AMA Told Doctors to Stop Using BMI Alone
In June 2023 the American Medical Association adopted a policy acknowledging BMI’s shortcomings and encouraging clinicians not to rely on it alone when diagnosing obesity.
The organization recommended pairing BMI with other risk measures, including direct assessment of visceral fat or body composition. Clinicians involved stressed that the problem is not BMI itself but the habit of treating it as the only focus.
What the CDC Itself Concedes
The agency publishing the national obesity statistics attaches its own caveat. In its 2024 data brief, the CDC notes that BMI has limitations, that body fat varies by sex, age, and race and Hispanic origin at any given BMI level, that BMI does not measure body fat directly, and that it says nothing about fat distribution.
Table 2. Key US statistics on BMI, body fat, and health risk
| Statistic | US Figure | Source and Year |
| Adult obesity prevalence (BMI-defined) | 40.3% | CDC NCHS Data Brief 508, NHANES Aug 2021 to Aug 2023 |
| Severe obesity prevalence | 9.4% of adults | CDC NCHS Data Brief 508, 2024 |
| Adults with obesity who have high blood pressure | 58% | CDC Adult Obesity Facts, 2025 |
| Adults with obesity who have diabetes | Approximately 23% | CDC Adult Obesity Facts, 2025 |
| Increased 15-year all-cause death risk with high body fat | 78% higher | Annals of Family Medicine, July 2025 |
| Increased heart disease death risk with high waist circumference | 4.01 times higher | Annals of Family Medicine, July 2025 |
| Metabolically healthy obesity among US adults | Rose from 3% to 7% over two decades | JAMA Network Open analysis of NHANES 1999 to 2018 |
That last row deserves a second look: metabolically healthy obesity climbed from 3% of US adults in 1999 to 2002 to 7% in 2015 to 2018, and among adults with obesity the metabolically healthy share rose from 11% to 15%.
Roughly one in seven Americans with a BMI over 30 shows no components of metabolic syndrome. Their BMI flags them. Their bloodwork clears them.
Why BMI Still Runs American Healthcare
If the science is this clear, why does the number still follow you everywhere? Because BMI is embedded in systems that move slowly, and most of those systems involve money.
Insurance and Coverage Decisions
Insurers have used weight-based screening since the actuarial tables of the early 1900s, and BMI slotted neatly into that machinery. Coverage criteria written around a single number are cheap to administer and easy to audit.
That administrative convenience is why the metric persists long after clinicians started questioning it.
Surgery and Medication Eligibility Thresholds
Bariatric surgery criteria in the US have traditionally keyed on BMI 40, or BMI 35 with a related condition. GLP-1 weight management drugs commonly use BMI 30, or 27 with a comorbidity, for coverage approval.
Those thresholds create a strange bind. Critics have pointed out that BMI is sometimes used to deny people joint replacements and other surgeries, which turns a rough screening tool into a gatekeeper.
Employer Wellness Programs and Physicals
Corporate wellness screenings, insurance physicals, and some occupational fitness standards still reduce body composition to BMI. A firefighter or a warehouse worker with substantial muscle can fail a screen they should pass easily.
Our lab partners report a steady stream of clients seeking body composition testing specifically to document what a workplace BMI screen got wrong.
What This Means for You Practically
Knowing BMI is flawed does not remove it from your paperwork. What it does is give you standing to ask that additional measurements go into your chart alongside it.
A documented waist circumference, a body fat reading, and a metabolic panel give your physician material to work with when the BMI number alone points the wrong direction.
Does BMI Fit You? A Reader-by-Reader Breakdown
Population averages are useless if you are the exception. Find yourself below.
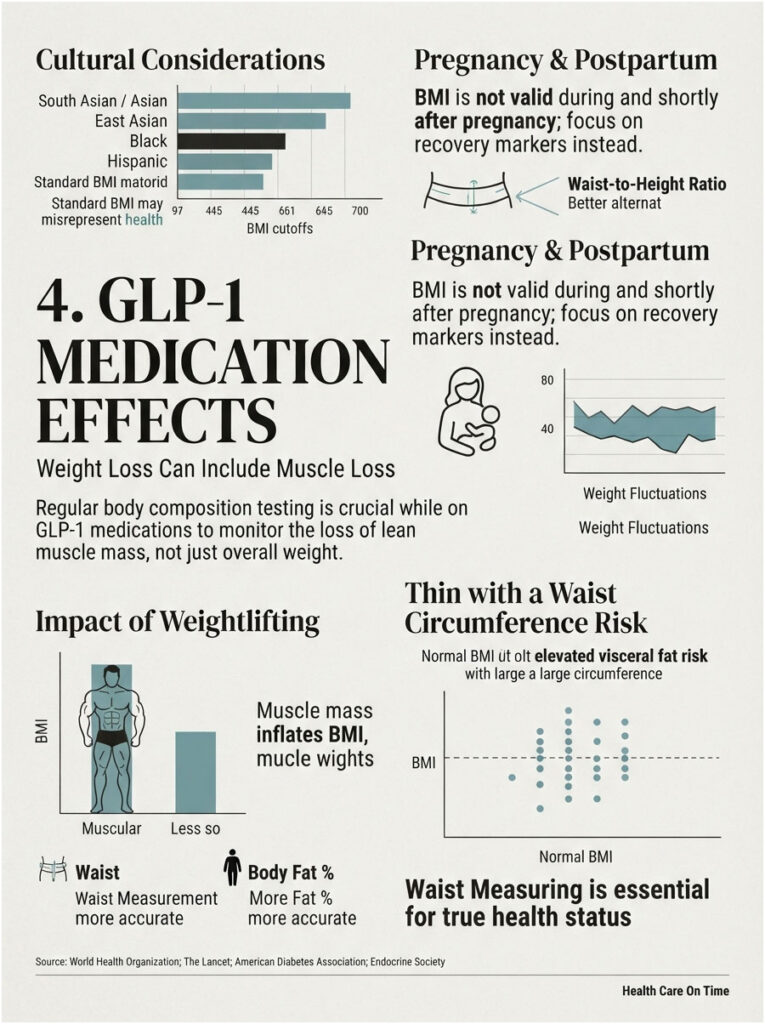
If You Lift Weights or Play a Strength Sport
Your BMI is almost certainly inflated and almost certainly meaningless. Muscle mass is doing the work the formula attributes to fat.
Measure your waist instead and get body fat percentage checked. With a waist-to-height ratio under 0.5 and clean labs, a BMI of 28 is a rounding error rather than a risk factor.
Track lean mass over time rather than total weight. Gaining five pounds of muscle and losing five pounds of fat produces zero movement on the scale and a meaningful improvement in health.
If You Are Over 60
Risk runs the opposite direction here. Age-related muscle loss, called sarcopenia, can hold your BMI perfectly steady while your body composition quietly deteriorates.
Research has found that some people in the overweight BMI category carry a lower risk of death from heart-related causes than people in the normal BMI range, a pattern especially visible in older adults. A stable BMI at 70 can conceal 15 pounds of muscle traded for 15 pounds of fat.
What to Watch Instead
Grip strength, chair-rise speed, walking pace, and waist measurement track functional health far better than BMI at this stage. Preserving muscle usually matters more than shedding pounds.
Unintentional weight loss after 65 deserves a conversation with your doctor, not celebration. Falling BMI in older adults frequently signals a problem rather than progress.
If You Are South Asian, East Asian, Black, or Hispanic
Standard cutoffs were not calibrated for you, and the difference carries clinical weight. CDC data shows obesity prevalence spanning from 49.9% among non-Hispanic Black adults to 16.1% among non-Hispanic Asian adults.
That range reflects both genuine differences and measurement artifact. Many people of South and East Asian descent develop insulin resistance and visceral fat accumulation at BMI values sitting well inside the normal band.
For these readers, waist-to-height ratio plus fasting glucose and a lipid panel is a far more honest screen than the BMI chart on the exam room wall. Earlier prediabetes screening is generally sensible.
If You Are Thin But Carry Weight at the Waist
This is the group BMI fails most dangerously, because the reassurance it offers is false. A normal BMI paired with a soft, protruding midsection points toward visceral fat, the metabolically active kind.
Measure your waist. If it exceeds half your height, your BMI is telling you something your body is not.
Being sedentary at a low weight is its own risk category. Thinness is not fitness, and the scale cannot tell the difference.
If You Are Pregnant or Postpartum
BMI is not valid during pregnancy, and applying it in the months after delivery invites unnecessary distress. Fluid retention, blood volume changes, and tissue remodeling all distort the calculation.
Discuss recovery markers with your OB-GYN instead of tracking a BMI category.
If You Are Unusually Tall or Unusually Short
The squared-height term skews results at both ends of the range. Above 6-foot-3 or below 5-foot-0, treat your BMI category as a rough hint and rely on waist-to-height ratio, which corrects for stature by design.
If You Are Taking a GLP-1 Medication
Weight loss on semaglutide or tirzepatide includes both fat and lean tissue, and BMI cannot distinguish between them. A falling BMI looks like unbroken success even when muscle loss is part of the picture.
Body composition testing every three to six months, plus resistance training and adequate protein, protects the lean mass that BMI ignores completely.
What to Measure Instead, Step by Step
You do not need a lab or an appointment to begin. You need a tape measure and about five minutes.
Step 1: Measure Your Waist Correctly
- Stand up straight, feet roughly shoulder-width apart, and remove bulky clothing
- Locate the top of your hip bone and the bottom of your ribs, then place the tape midway between them, usually level with your navel
- Keep the tape snug and horizontal without compressing the skin
- Breathe out normally and read the measurement at the end of the exhale
- Repeat twice and average the readings
Step 2: Calculate Your Waist-to-Height Ratio
Divide your waist by your height, using the same units for both. A 34-inch waist on a 68-inch frame gives 0.50.
A result of 0.5 or less is considered healthy, and the memory aid is simple: keep your waist half your height. Recheck every three months rather than every week.
Step 3: Get Body Composition Measured If You Can
A bioelectrical impedance reading at a clinic or gym gives you fat mass, lean mass, and a usable baseline. A DEXA scan supplies more detail when budget allows.
Value comes from repeating the measurement under matched conditions. One reading is a data point. Four readings across a year is information.
Step 4: Pull the Numbers BMI Can Never See
This is where the real risk hides. Request fasting glucose, HbA1c, a full lipid panel including triglycerides and HDL, liver enzymes (ALT and AST), and blood pressure.
Add hs-CRP if inflammation is a concern and thyroid function if unexplained weight change is part of the picture. A standard full body checkup panel covers most of this in one draw.
Our medical reviewers consistently find this panel reclassifies more patients than any body measurement does, in both directions.
Step 5: Track Function, Not Just Figures
How quickly do you recover after two flights of stairs? What is your resting heart rate? How well do you sleep, and can you carry groceries without strain?
These are not soft measures. They correlate with cardiovascular fitness and mortality more reliably than any single body metric.
Table 3. Your situation, and what to do about it
| Your Situation | What BMI Likely Gets Wrong | Measure This Instead | Recommended Next Step |
| Muscular, BMI 26 to 31, active | Overstates your risk | Waist-to-height ratio and body fat % | Confirm with a lipid panel and fasting glucose, then stop worrying about the category |
| BMI 22, soft midsection, sedentary | Understates your risk | Waist circumference and fasting labs | Book a metabolic panel; the scale is not clearing you |
| Age 65+, stable BMI, losing strength | Hides a muscle-for-fat swap | Grip strength, waist, body fat % | Start resistance training; request body composition testing |
| South Asian or East Asian, BMI 23 to 25 | Misses early insulin resistance | Waist-to-height ratio and HbA1c | Screen for prediabetes earlier than standard cutoffs suggest |
| BMI 32, normal blood pressure and labs | Overstates immediate danger | Full metabolic panel and waist | Preclinical picture; monitor annually and prioritize waist reduction |
| BMI 32 with high A1c and triglycerides | Roughly right, but incomplete | Waist, liver enzymes, blood pressure | Discuss a treatment plan with your physician promptly |
| On a GLP-1, BMI dropping fast | Cannot see lean mass loss | Body fat % every 3 to 6 months | Add resistance training and protein; track composition, not weight |
| Pregnant or under 6 months postpartum | Not valid at all | Clinical markers only | Follow your OB-GYN’s guidance and ignore the BMI category |
Mistakes to Avoid When You Move Past BMI
Replacing one number with a healthier relationship to your body is the goal. Replacing one number with four numbers and more anxiety is not.
Do Not Swap One Obsession for Another
Daily waist measurements and weekly body fat scans produce noise, not insight. Bodies fluctuate with hydration, sodium, sleep, and menstrual cycle.
Choose an interval of one to three months and hold to it.
Do Not Trust a Cheap Smart Scale as a Diagnostic
Consumer bioimpedance scales are reasonable for tracking direction over time. They are not accurate enough to diagnose anything, and readings shift with foot moisture and time since your last meal.
Use them for trends. Use a clinic-grade device or DEXA for a genuine baseline.
Do Not Ignore a High BMI Just Because You Feel Fine
This article argues for better measurement, not for dismissing risk. Analysis of NHANES data found that even metabolically healthy obesity carried elevated cardiovascular disease risk compared with metabolically healthy normal weight.
Feeling fine is not the same as being low-risk. Confirm it with labs rather than assuming.
Do Not Measure Inconsistently
Comparing a morning waist measurement to an evening one, or a fasted body fat reading to a post-workout reading, produces changes that exist only in the measurement. Same time, same conditions, same tape, every time.
Write the numbers down. Memory smooths data in whichever direction you want it to go.
Do Not Skip the Doctor Conversation
The AMA is not asking clinicians to abandon BMI, only to stop treating it as the whole answer. Your physician is your partner in reading the fuller picture.
How to Raise This Without Sounding Combative
Try something like: “Could we add a waist measurement and a metabolic panel today? I would like to see the fuller picture alongside my BMI.” Framing it as an addition rather than a challenge almost always gets a yes.
Some health experts have argued that heavy reliance on BMI can lead to patient distrust and delayed care, which is exactly the outcome a calm, collaborative conversation prevents.
The Bottom Line on BMI Accuracy
BMI is a 190-year-old population statistic doing a job it was never built for. It is fast, free, and useful at national scale, and it is a poor judge of the individual standing in front of it.
The number is a starting point, not a verdict. Even the researchers behind the 2025 mortality data describe BMI’s use as a vital sign of health as unsupported by good evidence.
Add a tape measure and a blood draw, and the picture sharpens dramatically. Waist under half your height, body fat in a healthy range, and clean metabolic labs mean far more than whichever box the BMI chart assigns you.
Across the tests booked through HealthCareOnTime, the patients who get the clearest answers are the ones who stopped asking “what is my BMI” and started asking “what is my waist, my A1c, and my triglycerides.”
Frequently Asked Questions
Is BMI accurate for most people?
At population level, reasonably so. For any individual it is unreliable, because it cannot separate fat from muscle or detect where fat is stored. Treat it as a first-pass screen that prompts further measurement, not as a standalone judgment about your health.
Why do doctors still use BMI if it is flawed?
Because it costs nothing, takes seconds, and needs no equipment. For decades no practical alternative existed in a busy clinic. Affordable bioimpedance devices and simple waist-to-height calculations have changed that, and clinical guidance is shifting accordingly.
Can you be healthy with a BMI over 30?
Yes, for some people. Roughly 15% of US adults with obesity meet criteria for metabolically healthy obesity. That group still carries somewhat elevated cardiovascular risk over time, so regular monitoring stays sensible rather than optional.
Is BMI accurate for muscular people and athletes?
No. Muscle is denser than fat, so athletes routinely land in the overweight or obese categories despite excellent health. Body fat percentage and waist-to-height ratio give lifters and strength athletes a far more accurate reading of actual risk.
What is a better alternative to BMI?
Waist-to-height ratio is the best free option, targeting below 0.5. Body fat percentage via bioimpedance adds precision, and DEXA offers the most detail. Pair any of them with fasting glucose, HbA1c, and a lipid panel.
Is BMI accurate for women?
Less so than for men, since the formula came largely from male bodies and ignores sex differences in fat distribution and essential fat needs. Healthy body fat runs roughly 21% to 32% for women versus 14% to 24% for men.
Is BMI accurate for Asian Americans and South Asians?
Often not. Cardiometabolic risk can appear at lower body sizes in these populations. Guidance already applies a tighter waist threshold of 31.5 inches for Asian women compared with 35 inches otherwise. Earlier prediabetes screening is advisable.
What is normal weight obesity?
It describes someone whose BMI sits in the normal range while their body fat percentage is high enough to raise metabolic risk. BMI screening misses these cases completely, masking metabolic and heart disease risk behind a reassuring number.
How accurate are home body fat scales?
Useful for direction, not for diagnosis. Readings move with hydration, meals, exercise, and foot moisture. Weigh in at the same time of day under matched conditions, and follow the multi-month trend rather than any single reading.
Is waist-to-height ratio better than BMI?
For predicting cardiometabolic risk, yes for most adults. It captures abdominal fat, which drives disease, and it adjusts for height automatically. The healthy range runs 0.4 to 0.5, with 0.5 to 0.6 signaling increased risk.
Does a high BMI always mean high health risk?
No. In a 15-year US study, a BMI of 25 or higher showed no statistically significant association with all-cause mortality. High waist circumference and high directly measured body fat did show clear, strong associations.
What blood tests show more than BMI ever could?
Fasting glucose and HbA1c for blood sugar control, a lipid panel for triglycerides and HDL, ALT and AST for liver health, and blood pressure. These measure how your metabolism is functioning, which is what determines long-term outcomes.
Medical Disclaimer
This article is for general information and education only. It is not medical advice, diagnosis, or treatment. BMI, waist measurements, and body composition readings should be interpreted by a licensed healthcare professional in the context of your full medical history. Always consult your physician before changing your diet, exercise routine, or medication.
References
- Obesity and Severe Obesity Prevalence in Adults, NCHS Data Brief 508, Centers for Disease Control and Prevention
- Adult Obesity Facts, Centers for Disease Control and Prevention
- Adult Obesity Prevalence Maps, Centers for Disease Control and Prevention
- Body Mass Index vs Body Fat Percentage as a Predictor of Mortality in Adults Aged 20-49 Years, Annals of Family Medicine, July 2025
- BMI a Poor Predictor of Future Health, University of Florida Health
- Redefining Obesity: Advancing Care for Better Lives, The Lancet Diabetes and Endocrinology Commission
- Definition and Diagnostic Criteria of Clinical Obesity, National Library of Medicine
- Why You Should Not Rely on BMI Alone, Yale Medicine
- BMI a Poor Metric for Measuring People’s Health, Say Experts, Harvard T.H. Chan School of Public Health
- BMI, aka Body Mass Index: What the Science Says, Stanford Medicine
- Is BMI Accurate?, Cleveland Clinic
- Is BMI Accurate? New Evidence Says No, University of Rochester Medical Center
- Overweight and Obesity Statistics, National Institute of Diabetes and Digestive and Kidney Diseases
- Dietitians Weigh In on BMI Alternatives, MD Anderson Cancer Center
- The History and Faults of the Body Mass Index and Where to Look Next, National Library of Medicine