
A BUN of 22 mg/dL can be completely unremarkable in a 74-year-old man and worth a phone call in a 7-year-old. Same number, same units, same lab.
Table of Contents
The difference is age. Yet most lab reports print one adult reference range beside every result, no matter whose blood it came from. That single design choice sends thousands of Americans to a search bar each day, printout in hand.
Quick Answer: For most healthy US adults, a normal BUN (blood urea nitrogen) level runs 7 to 20 mg/dL, though many labs report 6 to 24 mg/dL. Adult women typically fall between 6 and 21 mg/dL and adult men between 8 and 24 mg/dL. Children ages 1 to 17 usually sit at 7 to 20 mg/dL, newborns much lower at 3 to 12 mg/dL, and adults over 60 slightly higher.
At a Glance
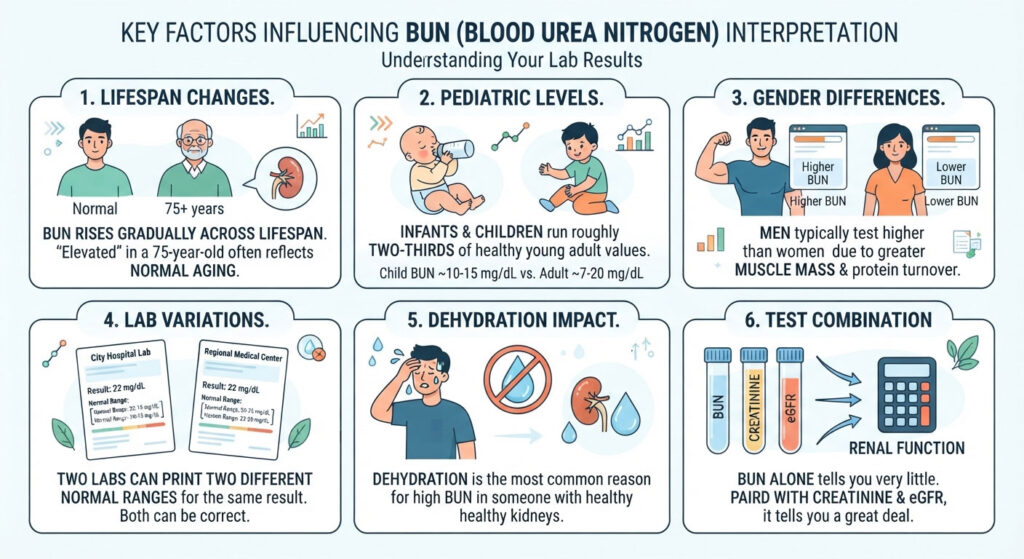
• BUN rises gradually across the lifespan, so an “elevated” result in a 75-year-old often reflects normal aging rather than disease.
• Infants and children run roughly two thirds of healthy young adult values.
• Men typically test higher than women because of greater muscle mass and protein turnover.
• Two labs can print two different normal ranges for the same result, and both can be correct.
• Dehydration is the single most common reason a BUN comes back high in someone with healthy kidneys.
• BUN read alone tells you very little. Paired with creatinine and eGFR, it tells you a great deal.
BUN Normal Range by Age: The Complete Reference Chart
Most published charts stop somewhere. Some end at “adult.” Others stop at 60. Below is the full span, assembled from clinical reference sources rather than a single publisher.
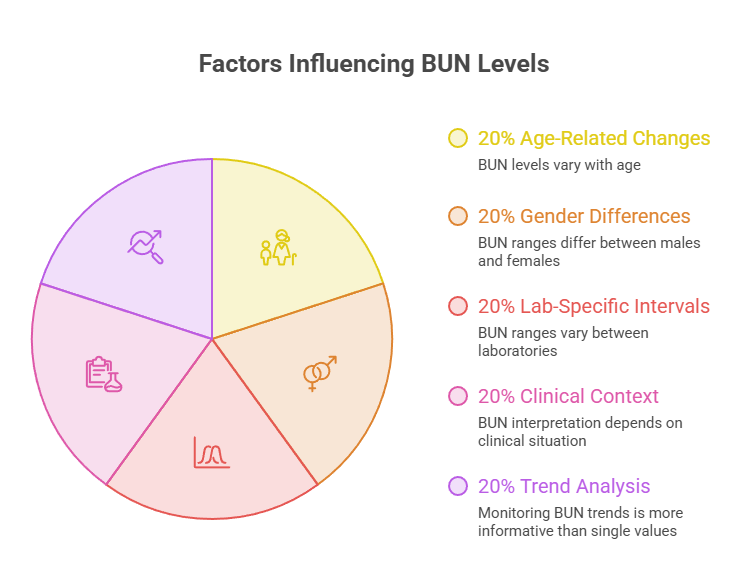
Your own lab’s printed interval always takes precedence over any chart online, including this one.
| Age Group | Typical BUN (mg/dL) | SI Units (mmol/L) | What Drives This Range | Source Basis |
| Cord blood (at birth) | 21 to 40 | 7.5 to 14.3 | Maternal urea crossing the placenta | Medscape |
| Newborn, 0 to 2 months | 3 to 12 | 1.1 to 4.3 | Immature filtration, very low protein intake | Medscape, Ubie |
| Infant to child, 2 months to 12 years | 5 to 18 | 1.8 to 6.4 | Roughly two thirds of young adult values | Medscape |
| Child, 1 to 17 years | 7 to 20 | 2.5 to 7.1 | Consumer-facing pediatric band | Cleveland Clinic |
| Adolescent, 13 to 17 years | 7 to 20 | 2.5 to 7.1 | Physiology approaching adult levels | Ubie |
| Adult female, 18 to 59 | 6 to 21 | 2.1 to 7.5 | Lower average muscle mass | Cleveland Clinic |
| Adult male, 18 to 59 | 8 to 24 | 2.9 to 8.6 | Higher muscle mass, greater protein turnover | Cleveland Clinic |
| Older adult, 60 to 69 | 8 to 23 | 2.9 to 8.2 | Gradual decline in filtration rate | Ubie |
| Older adult, 70 and above | Up to roughly 26 to 32, lab dependent | Up to roughly 9.3 to 11.4 | Continued age-related GFR decline | Lab-specific intervals |
Newborns and infants: why the numbers start so low
Cord blood is the outlier, and for a logical reason. Medscape lists cord blood BUN at 21 to 40 mg/dL, well above the newborn range of 3 to 12 mg/dL, because that sample still reflects maternal urea.
Within days of birth, values drop sharply. A newborn’s kidneys are still maturing, and a milk-only diet delivers modest protein compared with adult intake.
Both factors push the number down. A BUN of 5 mg/dL in a two-week-old is unremarkable. The same value in a 45-year-old man would prompt a closer look at nutrition and liver function.
Children and teens: the two-thirds rule
There’s a useful shorthand here. In infants and children, BUN levels run about two thirds of those found in healthy young adults, which explains why adult reference ranges misclassify pediatric results so often.
Medscape places children and infants at 5 to 18 mg/dL, while Cleveland Clinic’s consumer band for ages 1 to 17 is 7 to 20 mg/dL. The overlap is wide and the low-end gap is real.
In pediatric panels reviewed by our medical team, a child’s BUN near 6 mg/dL is far more often normal physiology than a warning sign. What matters is whether the value tracks with the child’s growth, hydration, and appetite.
By mid-adolescence, values converge on adult ranges. Growth spurts, shifting appetite, and changing body composition create mild fluctuation along the way.
Adults 18 to 59: why men and women get different bands
This is the age split almost every lab report ignores, and it is clinically meaningful. Cleveland Clinic separates them: 6 to 21 mg/dL for adult females, 8 to 24 mg/dL for adult males.
The reason is body composition. Values are slightly higher in males than in females, probably reflecting the lower muscle mass in women. More muscle means more protein turnover, which means more urea in circulation.
A woman with a BUN of 22 mg/dL sits at the edge of her band. A man with the identical result is comfortably inside his. Same number, different meaning. Our lab partners see this misread constantly.
Adults 60 and older: when “high” is just “older”
Kidney filtration declines gradually with age in nearly everyone. That is ordinary biology, not pathology, and BUN reflects it.
Levels in adults older than 60 are slightly higher than in younger adults. Reported bands for this group commonly run 8 to 23 mg/dL, with some lab intervals extending further past age 70.
The elderly under-recognition trap
The problem cuts both ways. Applying a young-adult range to an 80-year-old flags plenty of healthy seniors as abnormal, generating anxiety and unnecessary repeat testing.
Applying it too loosely does the opposite. Clinicians are cautioned that using standard adult ranges in elderly patients can lead to under-recognition of genuinely elevated values.
The practical answer is trend, not snapshot. A stable 22 mg/dL across three annual panels reads very differently from a jump from 14 to 22 in eight months. If your BUN is climbing, the serum creatinine result printed beside it is the next number to check.
What a BUN Test Actually Measures
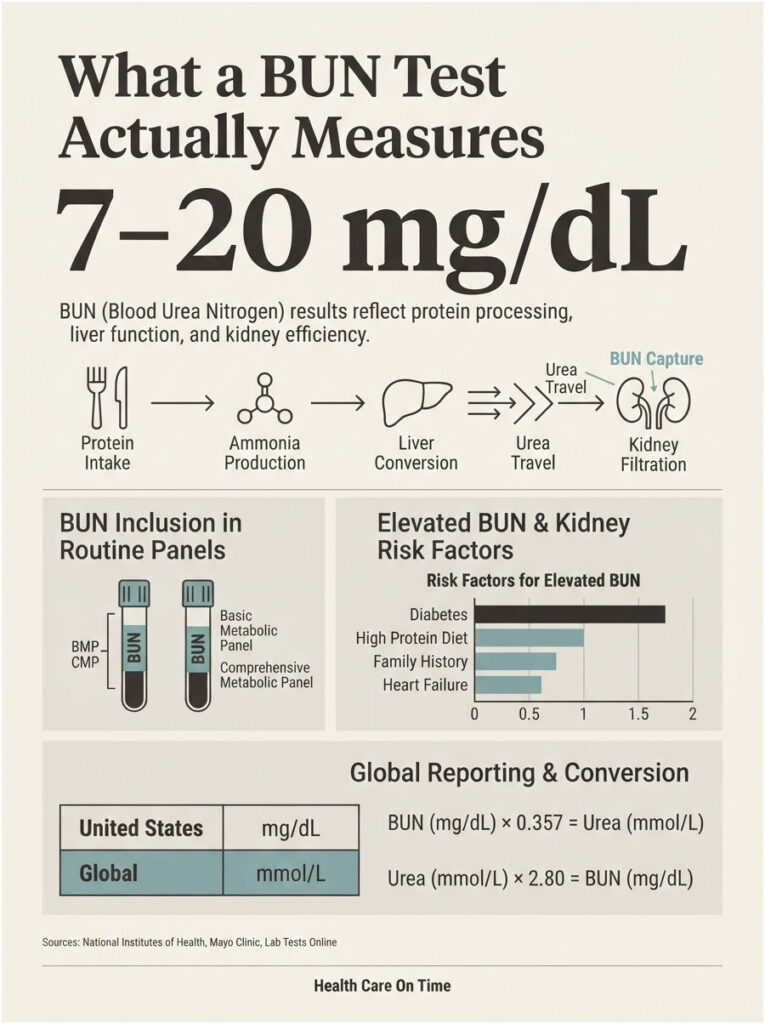
BUN stands for blood urea nitrogen. It measures the nitrogen portion of urea circulating in your bloodstream, reported in the US as milligrams per deciliter.
From protein to urea to your kidneys
When your body breaks down protein, whether from a steak, a protein shake, or your own tissue, ammonia is produced as a byproduct. Ammonia is toxic, so your liver converts it into urea, a far safer molecule.
Urea travels through your blood to your kidneys, which filter it out and send it into your urine. A small, steady amount stays in circulation at any moment, and that amount is what the test captures.
So a BUN result sits at the intersection of three systems: how much protein you are processing, how well your liver converts it, and how efficiently your kidneys clear it. That is why the number moves for reasons unrelated to kidney disease.
Why BUN sits on almost every routine blood panel
You rarely order a BUN by itself. It arrives bundled inside a basic metabolic panel (BMP) or the larger comprehensive metabolic panel (CMP), alongside sodium, potassium, glucose, creatinine, and calcium.
Cleveland Clinic notes that providers also order it specifically when kidney disease risk is elevated, including family history, diabetes, high blood pressure, or heart disease.
Patients booking metabolic panels through HealthCareOnTime frequently ask why a test they never requested showed up on their results. It was almost certainly part of the panel bundle, and that is a good thing, since early kidney trouble is silent.
mg/dL, mmol/L, and the “urea” confusion
Here is a distinction that trips up more people than it should. The United States reports BUN in mg/dL. Much of the rest of the world reports total urea in mmol/L. They are not the same measurement.
To convert BUN in mg/dL into mmol/L, multiply by 0.357. A BUN of 15 mg/dL becomes roughly 5.4 mmol/L.
To move between BUN and total urea, the relationship is urea equals BUN multiplied by about 2.14. If you are comparing a US report with a British or Indian one, running that conversion first prevents a lot of unnecessary alarm.
Why Two Labs Give You Two Different “Normal” Ranges
You get bloodwork at one clinic, then again six months later at another, and the reference range in the margin has changed. Nothing went wrong. Reference intervals are built, not decreed.
The reference interval process in plain English
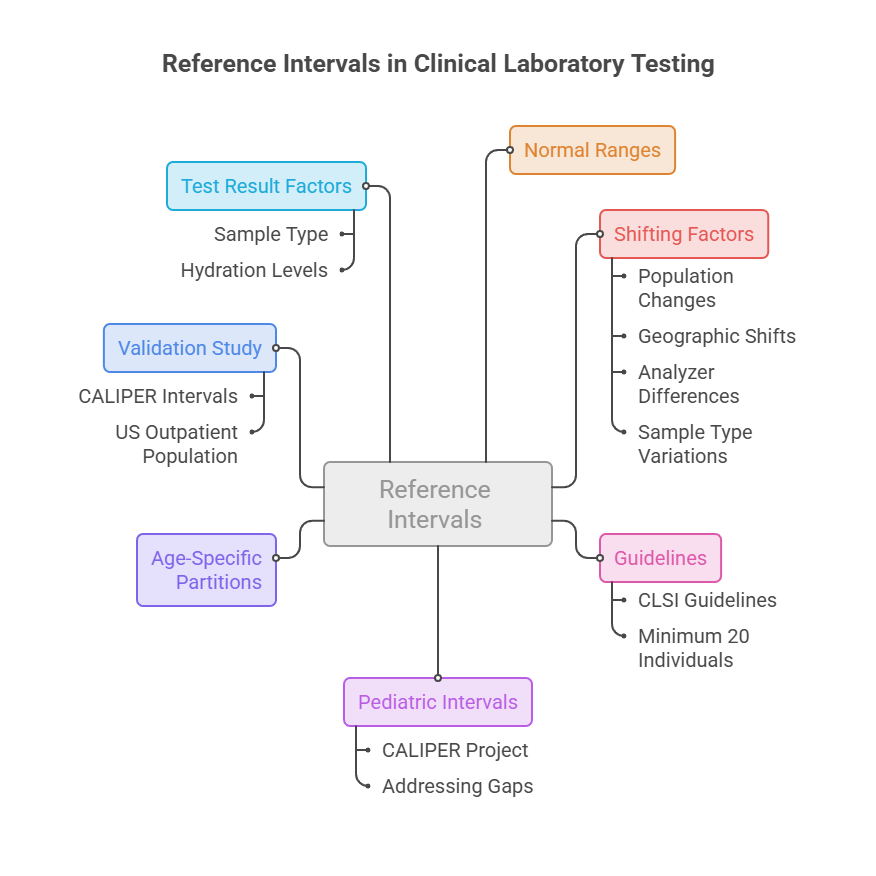
A reference interval is a statistical construct. A laboratory samples a healthy population, measures the analyte, and defines “normal” as the middle 95 percent of results.
Change the population, the geography, the analyzer, or the sample type, and the interval shifts. CLSI guidelines recommend a minimum of 20 healthy individuals per age or sex partition to confirm local applicability, and even that modest number is hard to gather.
In pediatrics, ethical concerns about blood collection, limited access to healthy volunteers, and parental reluctance frequently limit recruitment. That scarcity is exactly why children’s reference ranges lagged behind adult ones for decades.
What CALIPER changed for children’s lab reports
The Canadian Laboratory Initiative on Pediatric Reference Intervals was built to close that gap, and US laboratories now lean on its data heavily.
CALIPER established new pediatric reference intervals for 16 electrolytes and metabolites including urea, with age-specific partitions required for all analytes. Sex-specific partitions were not needed for every marker, but age partitions were universal.
That single finding is the scientific backbone of this entire article. Age partitioning is not a convenience. It is a requirement.
Assay method and sample type matter more than you would think
A 2026 validation study tested how well CALIPER intervals hold up in a US outpatient population. RefineR-based reference intervals aligned with CALIPER values in 86 of 88 age- and gender-specific analyte groups.
BUN was among the markers showing notable discrepancies. Those differences were often influenced by known preanalytical and physiological variables such as sample type, body mass index, and hydration status.
Translation for the person holding a lab report: whether you drank water that morning may shift your result more than the difference between two labs’ printed ranges. Our medical reviewers flag this whenever a patient asks why a repeat test looked different.
One more thing worth knowing. Many major labs have moved to broader adult BUN ranges such as 6 to 24 mg/dL rather than the older 10 to 20 mg/dL, reflecting updated population norms. If your older records used the narrower band, a result that looked borderline then may sit mid-range today.
BUN Across the US Population: What the Data Shows
Reference ranges describe healthy people. Population data describes who actually needs watching.
| Statistic | Figure | Population and Period | Source |
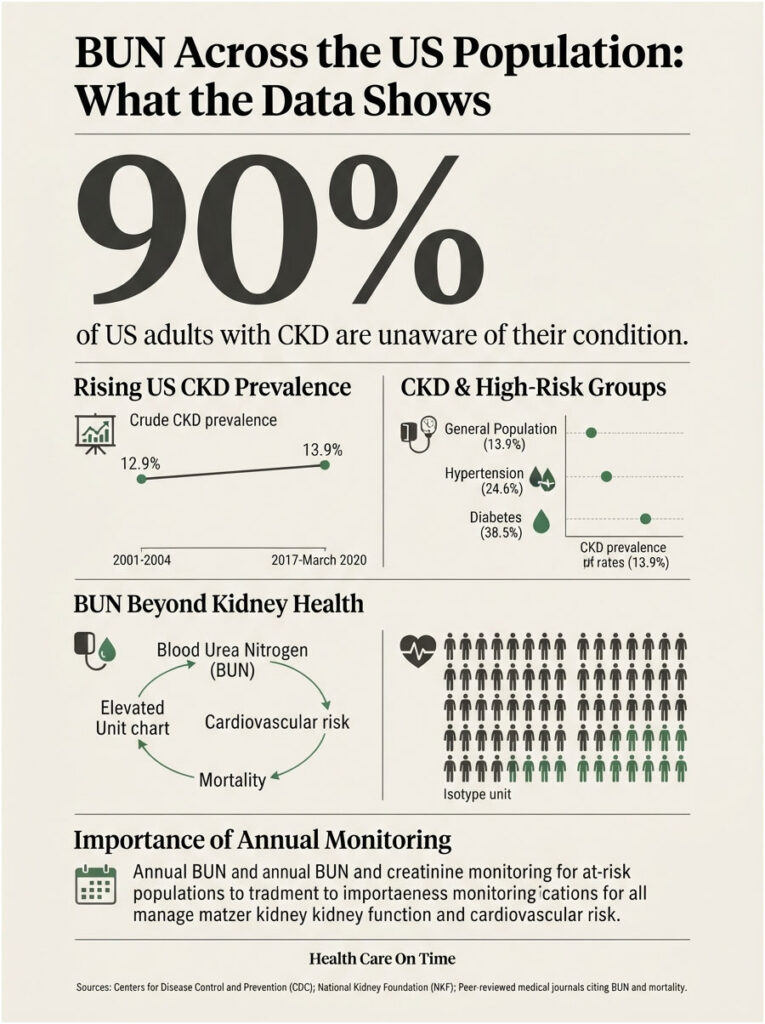
| Crude CKD prevalence, US adults 18+ | 13.9% | 2017 to March 2020 | CDC Kidney Disease Surveillance System |
| CKD prevalence, prior period | 12.9% | 2001 to 2004 | CDC Kidney Disease Surveillance System |
| CKD prevalence among adults with hypertension | 24.6% | 2017 to March 2020 NHANES | National Kidney Foundation |
| CKD prevalence among adults with diabetes | 38.5% | 2017 to March 2020 NHANES | National Kidney Foundation |
| US adults with CKD who are unaware of it | About 9 in 10 | Current estimate | America’s Health Rankings |
| Pediatric BUN/creatinine ratio of 30+ for upper GI bleeding | 68.8% sensitivity, 98% specificity | Children | Medscape |
Kidney disease is common, quiet, and growing
Crude CKD prevalence among US adults aged 18 and over reached 13.9 percent during 2017 to March 2020, compared with 12.9 percent during 2001 to 2004, with prevalence higher in adults aged 70 and over, in women, and in adults with diabetes or hypertension.
The silence is the dangerous part. Nine in ten adults with chronic kidney disease do not know they have it, because the condition progresses slowly and often goes undiagnosed.
Risk concentrates sharply. CKD prevalence reached 24.6 percent among adults with hypertension and 38.5 percent among adults with diabetes in the 2017 to March 2020 NHANES cycle. If either applies to you, your BUN and creatinine deserve annual attention.
What elevated BUN predicts beyond the kidneys
BUN turns out to carry information about cardiovascular risk, not only renal function.
An NHANES analysis of 17,719 US adults followed through December 2015 documented 3,628 deaths, of which 859 were cardiovascular. After adjustment for demographics, lifestyle factors, and hypertension and diabetes history, higher BUN was associated with elevated cardiovascular risk and all-cause mortality.
Read that as association, not causation. A high BUN does not cause heart disease. It appears to travel alongside the metabolic and circulatory stress that does.
High BUN by Age Group: What Actually Causes It
A result above your age band is a question, not an answer. Here is what the question usually turns out to be.
Dehydration, by a wide margin the most common cause
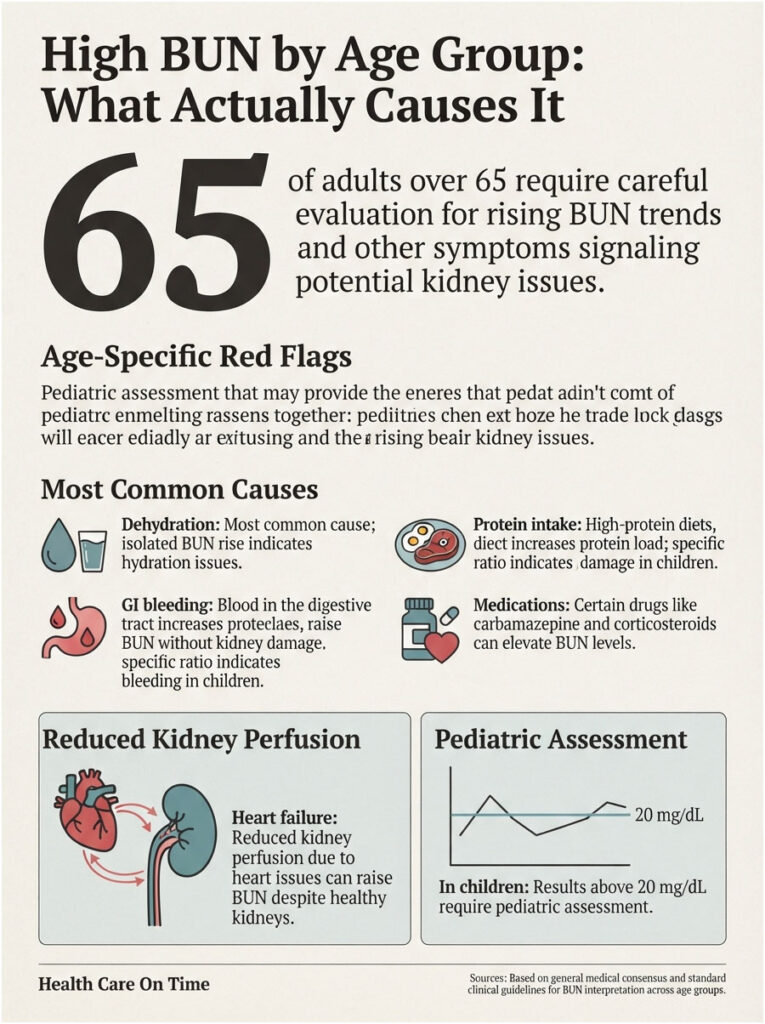
Less fluid means more concentrated blood, which raises BUN without any change in kidney tissue. Cleveland Clinic notes that an isolated rise in BUN while serum creatinine stays relatively low can indicate dehydration.
Across panels processed through our diagnostic network, an isolated BUN bump with a flat creatinine is far more often a hydration story than a kidney story.
General fluid guidance from Cleveland Clinic sits at roughly 13 cups daily for men and 9 cups for women. Anyone on dialysis or with diagnosed kidney disease should follow their own provider’s fluid limits instead.
Protein intake, including the gym crowd
More dietary protein means more urea produced. A high-protein diet reliably nudges BUN upward in people with entirely healthy kidneys.
This shows up often in athletes and lifters eating 150 grams of protein a day or more. It is a diet signal, not a disease signal, provided creatinine and eGFR stay normal.
GI bleeding, the cause nobody expects
Blood in the digestive tract gets digested like any other protein. That protein load converts to urea, and BUN climbs sharply.
In children the pattern is diagnostically useful. A BUN-to-creatinine ratio of 30 or greater carries 68.8 percent sensitivity and 98 percent specificity for upper gastrointestinal bleeding in pediatric patients.
Medications that push BUN up
Several common drug classes raise BUN. Cleveland Clinic lists carbamazepine, methotrexate, and tetracycline among them, and corticosteroids and certain diuretics belong on the list too.
Bring your full medication list to any conversation about an elevated result, including over-the-counter items and supplements. Never stop a prescribed drug based on a lab value alone.
Heart failure and reduced kidney perfusion
When the heart pumps less effectively, less blood reaches the kidneys, and filtration drops. BUN rises even though the kidneys themselves may be structurally fine.
Cleveland Clinic also lists burns, urinary tract blockage, physiological stress, and heart attack as contributors.
Age-specific red flags
In children
Because the pediatric band tops out around 18 to 20 mg/dL, a child’s result above 20 falls outside expectation and warrants pediatric evaluation. Adult ranges should not be applied.
Combine that with reduced urination, poor appetite, unexplained swelling, or lethargy and the visit becomes same-week rather than next-month.
In adults over 65
Mild elevation is often age-appropriate. The pattern that matters is a rising trend paired with rising creatinine, or a BUN that jumps after starting a new medication.
Reduced urine output, foamy urine, blood in urine, persistent fatigue, or swelling in hands, feet, and ankles are the later-stage kidney symptoms worth acting on at any age.
Low BUN: Less Common, Still Worth a Second Look
Low BUN gets far less attention than high BUN, partly because it is genuinely less frequent and partly because it is less often dangerous. It still carries information.
Overhydration, low protein intake, and small body frame
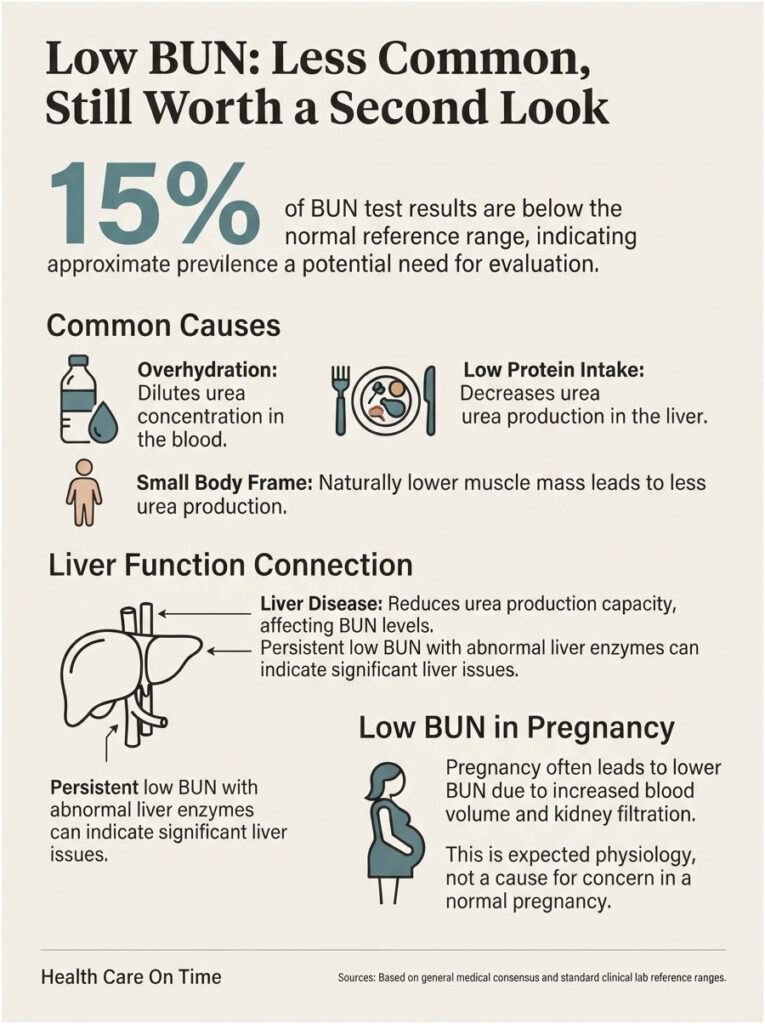
Drinking large volumes of water dilutes urea concentration. Very low dietary protein reduces how much urea gets made in the first place.
A smaller body simply produces and carries less. Cleveland Clinic lists low-protein diet, small body type, overhydration, and liver disease as the recognized causes.
Liver disease and the front end of the pathway
Remember that the liver, not the kidney, makes urea. Significant liver impairment reduces urea production, so BUN falls even when kidney function is intact.
That is why a persistently low BUN alongside abnormal liver enzymes points somewhere entirely different from a kidney workup. For a deeper breakdown, see our dedicated guide to low blood urea nitrogen levels.
Pregnancy, the range almost nobody publishes
Blood volume expands substantially during pregnancy, and kidney filtration rate increases along with it. Both effects dilute and clear urea faster.
The result is a BUN that commonly sits below the standard adult range. Patients commonly ask us whether that is a problem. In an otherwise normal pregnancy, it is expected physiology rather than a finding.
BUN Alone Is Not Enough: Reading It With Creatinine and eGFR
This is the section that separates a useful lab interpretation from a frightening one. BUN in isolation is a weak signal. BUN alongside creatinine is a diagnostic pattern.
The BUN/creatinine ratio and what the pattern reveals
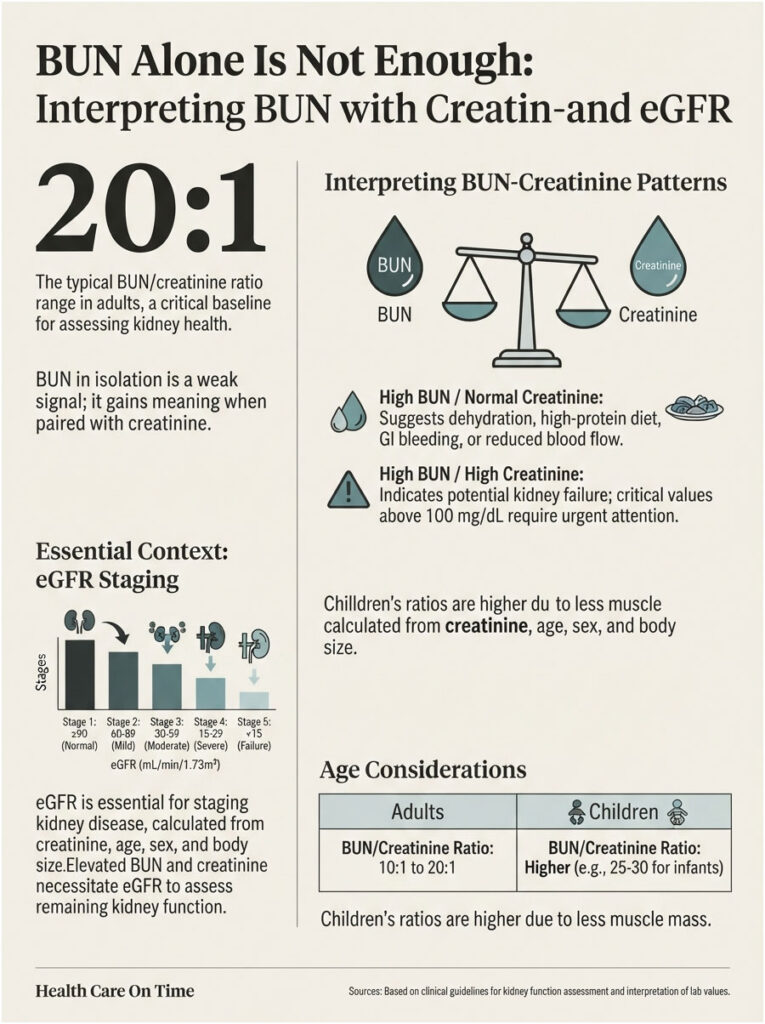
Divide BUN by serum creatinine. In adults the ratio typically lands between about 10:1 and 20:1.
The ratio matters because BUN and creatinine respond to different pressures. Creatinine reflects muscle breakdown and kidney filtration. BUN adds diet, hydration, liver function, and blood volume on top.
High BUN with normal creatinine
This is the reassuring pattern. It usually points to something outside the kidney: dehydration, a high-protein diet, GI bleeding, or reduced blood flow from heart failure.
The kidneys are filtering fine. Something upstream is delivering more urea than usual, or delivering less blood.
High BUN with high creatinine
This is the pattern that earns follow-up. Cleveland Clinic notes that while BUN is not used on its own to define kidney failure, a BUN above baseline combined with elevated creatinine makes kidney failure likely.
Medscape flags a possible critical value at greater than 100 mg/dL, indicating seriously impaired renal function. That is an emergency-department number, not a wait-and-see number.
Why children’s ratios run higher
Children have less muscle mass, so their serum creatinine is lower. A lower denominator produces a higher ratio even when everything is normal.
In infants and young children, ratios up to 25 to 30 can fall within normal limits, with the adult 10 to 20 range applying roughly from adolescence onward. A pediatric ratio compared against adult standards will look alarming when it is not.
Where eGFR fits
Estimated glomerular filtration rate is the number nephrologists actually stage kidney disease with. It is calculated from creatinine along with age, sex, and body size.
If your BUN and creatinine are both up, eGFR quantifies how much filtering capacity remains. Ask for it by name.
What to Do With Your Number
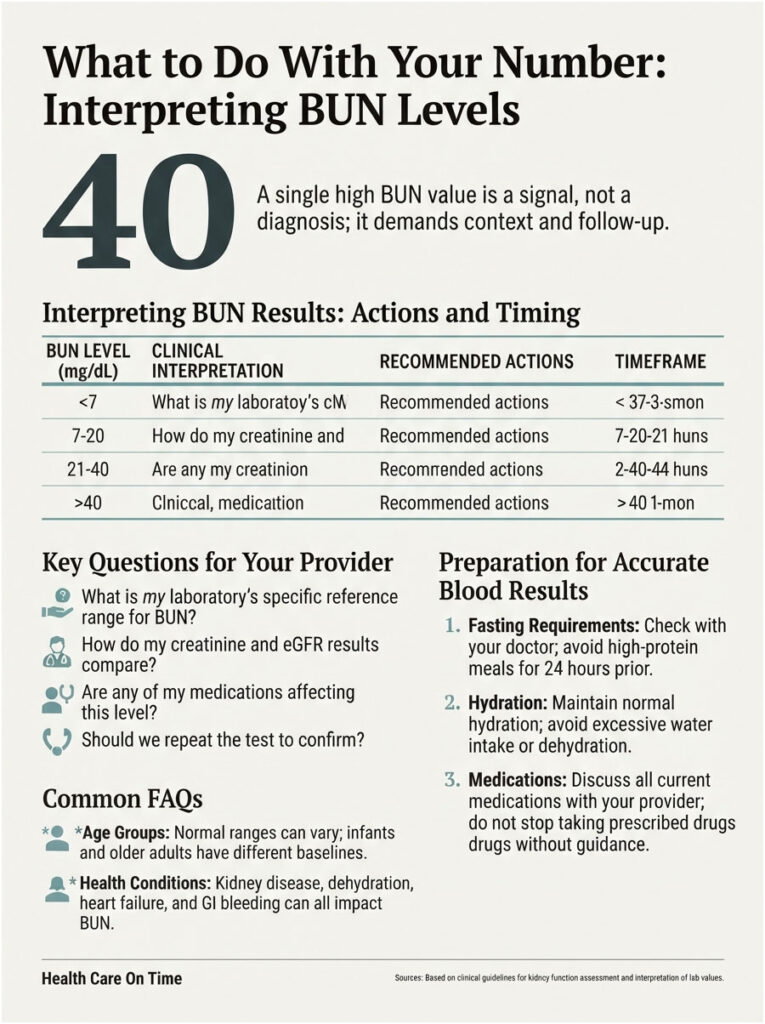
Here is the practical translation from result to next step.
| Your Situation | What It Likely Means | Recommended Action | Timeframe |
| Adult, BUN 7 to 20, creatinine normal | Standard range | Repeat at your next annual panel | 12 months |
| Adult, BUN 21 to 30, creatinine normal | Dehydration or protein load most likely | Normalize fluids, retest well-hydrated | 2 to 4 weeks |
| Adult, BUN 21 to 30, creatinine also elevated | Possible reduced filtration | Request creatinine, eGFR, and urine albumin | Within 2 weeks |
| Adult over 65, BUN 21 to 26, stable across tests | Often age-appropriate drift | Track the trend, do not chase one value | Next scheduled panel |
| Any age, BUN above 50 | Significant dysfunction possible | Contact your provider promptly | Same week or sooner |
| Child, BUN above 20 | Outside the pediatric band | Pediatric evaluation, do not use adult ranges | Within days |
| Any age, BUN below 6 with symptoms | Liver, nutrition, or dilution effect | Provider review with a liver panel | Within 2 weeks |
Questions worth asking your provider
Ask what reference range that specific lab uses, since the printed interval may differ from what you found online. Ask what your creatinine and eGFR were on the same draw.
Ask whether any current medication could be contributing. Ask whether the value has moved compared with previous panels, because direction beats position.
How to prep so your result reflects reality
Hydrate normally in the 24 hours before your draw, neither loading up nor restricting. Skip an unusually large protein meal the night before.
Tell the phlebotomist if you take blood thinners or have a bleeding disorder. Ask whether the panel requires fasting, since some accompanying tests need 8 to 12 hours without food or drink even though BUN itself generally does not.
If kidney function is a live concern for you, a full renal panel gives more usable information than a standalone BUN. Our team can help you book a kidney function test with the right markers included.
Frequently Asked Questions
What is a normal BUN level for a 70-year-old?
Most labs accept roughly 8 to 23 mg/dL for adults over 60, and some extend higher past age 70. Kidney filtration declines naturally with age, so mild elevation is often expected. What matters more is whether the value stays stable across repeat testing.
Is a BUN of 25 dangerous?
Usually not on its own. It sits just above the common 7 to 20 mg/dL band but inside the 6 to 24 range some labs use, and squarely inside the male adult range of 8 to 24 mg/dL. Dehydration or a high-protein meal explains most results at this level.
What is the normal BUN range for a child?
Children ages 1 to 17 typically run 7 to 20 mg/dL, while some references place infants and younger children at 5 to 18 mg/dL. Pediatric values sit roughly two thirds of healthy young adult levels. Adult reference ranges should never be applied to a child’s result.
Does BUN naturally increase with age?
Yes. Glomerular filtration rate declines gradually across adulthood, so urea clears a little more slowly each decade. Reference sources place adults over 60 slightly above younger adults. That drift is ordinary biology, though a sharp rise over a few months still deserves evaluation.
What BUN level indicates kidney failure?
No single BUN number defines kidney failure. Providers look for a BUN above your personal baseline combined with elevated creatinine. Medscape flags values above 100 mg/dL as a possible critical result indicating seriously impaired renal function requiring immediate care.
Why is my BUN high but my creatinine normal?
This pattern usually points away from the kidneys. Dehydration is the most frequent explanation, followed by a high-protein diet, gastrointestinal bleeding, and reduced kidney blood flow from heart failure. Your kidneys are filtering normally, but something upstream is raising the urea load.
What is a normal BUN level for a woman over 60?
Adult women generally range from 6 to 21 mg/dL, and after 60 the upper limit commonly extends toward 23 mg/dL. Women typically test lower than men because of lower average muscle mass. A stable result near the upper edge is rarely concerning by itself.
Is a BUN of 8 too low?
No. Eight sits comfortably inside every standard adult range, including the female band of 6 to 21 mg/dL. Low BUN generally becomes worth investigating below about 6 mg/dL, and even then the usual causes are overhydration, low protein intake, or a small body frame.
What is the normal BUN range during pregnancy?
Pregnancy BUN typically falls below the standard adult range. Blood volume expands considerably and kidney filtration increases, so urea gets diluted and cleared faster. A low reading in an otherwise healthy pregnancy is expected rather than abnormal, though your obstetric provider should interpret it.
How do I convert BUN from mg/dL to mmol/L?
Multiply your BUN in mg/dL by 0.357. A BUN of 15 mg/dL equals about 5.4 mmol/L. Note that international reports often list total urea rather than BUN, and urea equals BUN multiplied by roughly 2.14, so check which value you are reading.
Can drinking water before a blood test lower my BUN?
Hydration status genuinely affects the result, since dehydration concentrates urea and raises the number. Research on reference intervals lists hydration status among the variables influencing BUN measurement. Drink normally rather than loading up, so your result reflects your usual state.
Is BUN or creatinine more important for kidney health?
Creatinine is the stronger single indicator, and eGFR calculated from it is what clinicians use to stage kidney disease. BUN adds context creatinine misses, including hydration, protein intake, and gastrointestinal bleeding. The two read together are far more informative than either alone.
Medical Disclaimer: This article is educational and does not replace medical advice, diagnosis, or treatment. Reference ranges vary between laboratories, testing platforms, and patient populations, so the interval printed on your own report takes precedence over any chart published online. A single BUN value cannot diagnose or exclude kidney disease. Always discuss your results with a licensed healthcare provider who can interpret them alongside your creatinine, eGFR, medications, medical history, and symptoms.
References
- Cleveland Clinic: Blood Urea Nitrogen (BUN) Test
- Medscape: Blood Urea Nitrogen (BUN) Reference Range, Interpretation, Collection and Panels
- CDC Kidney Disease Surveillance System: Trends in Prevalence of CKD among U.S. Adults
- CDC: Chronic Kidney Disease in the United States Fact Sheet
- National Kidney Foundation: Kidney Disease Fact Sheet
- America’s Health Rankings: Chronic Kidney Disease in the United States
- PubMed: Validating CALIPER Pediatric Reference Intervals in a U.S. Population Using Retrospective Outpatient Data and RefineR
- ADLM: CALIPER Pediatric Reference Standards on Roche Chemistry and Immunoassay Systems
- Association of Blood Urea Nitrogen with Cardiovascular Diseases and All-Cause Mortality in USA Adults: NHANES 1999 to 2006
- MedlinePlus: BUN (Blood Urea Nitrogen)